Part 3: Open Investigation
Click Open Investigation
Click Begin
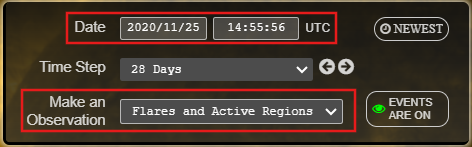
Change the date to today's date
Change the Make an Observation drop down at the top center to Sunspots.
3
How many spots do you see?
How many groups do you see?
Part 1: Solar Cycle
Click on Solar Cycle.
What indicates high levels of solar activity and the potential for solar storms?
What two counts are needed to estimate the sunspot number?
Which issue makes counting sunspots and groups challenging?
Click next to the sunspot estimation practice.
How many groups and how many individual spots do you see?
Click next. You will predict the sunspot groups and individual spots 5 more times.
From December 2020 to January 2012, the number of sunspots
Click next and observe the graph.
What conclusion could be made about the number of sunspots over time?
Part 2: Storm Prediction
Click on Storm Prediction.
Choose Huge Spots.
The larger the sunspot, the the magnetic field and the its potential for generating solar storms.
Click next.
Compare the 2 active regions. Use the arrows to move both images forward or backward in time.
Which region do you think is most likely to flare?
Click Back to Storm Prediction Menu.
Chose Complicated Spots.
Which are more likely to produce flares?
Click next.
Compare the changes in 2 regions. Use the arrows to move both images forward or backward in time.
Which region do you think is most likely to flare?
Click Back to Storm Prediction Menu.
Chose Rapid Growth.
Which is a sign of a strong magnetic field?
Click next.
Compare the 2 regions. Use the arrows to move both images forward or backward in time.
Which region do you think is most likely to flare?
Click Return to Storm Prediction Menu.
Choose Mixed-up Magnetic Fields
What do mixed up magnetic fields indicate?
Click next.
Compare the 2 regions. Use the arrows to move both images forward or backward in time.
Which region do you think is most likely to flare?
Click Back to Storm Prediction Menu
Choose Threatening Filaments
Filaments can indicate the strong possibility of a storm.
Click next.
Compare the 2 regions.
Which region do you think is most likely to flare?
Part 3: Open Investigation
Click Open Investigation
Click Begin
Change the date to today's date
Change the Make an Observation drop down at the top center to Sunspots.
3
How many spots do you see?
How many groups do you see?
Change the date to December 3, 2019
How many spots do you see?
How many groups do you see?
Change the date to today's date.
How does solar activity today compare with 2019 and how do you know?