Background
The Hertzsprung-Russell diagram, often called the HR diagram, is a crucial tool for studying how stars change over time. Created in the early 1900s by two scientists, Ejnar Hertzsprung and Henry Norris Russell, this diagram shows the relationship between a star's temperature and color and its brightness, or luminosity.
Every star develops through specific stages based on its initial mass, which affects its internal structure and energy production. As a star goes through these stages, its temperature and luminosity change.
This movement can be tracked on the HR diagram, showing how the star evolves over time. The HR diagram is powerful because astronomers can determine a star's internal structure and its stage of evolution just by looking at where it is located on the diagram.

We will be using the Star in a Box interactive.
Open the lid.
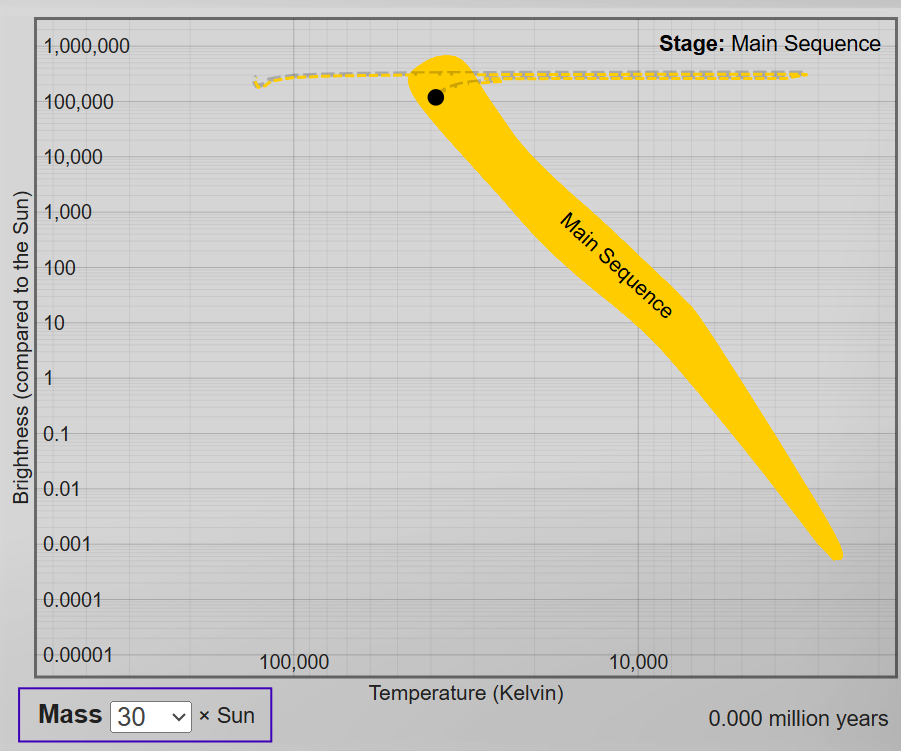
The main plot is a Hertzsprung-Russell diagram. On the right, the information panel allows comparisons between the radius, surface temperature, and luminosity of the star relative to the Sun.
The starting parameters are for a star like the Sun.
Change the play speed to "normal."
Click play and observe the movement on the HR Diagram (left) and the comparison to the Sun (right).
How the star's radius (size) change over time?
Change the information panel to "Surface temperature."
Click play and observe the movement on the HR Diagram (left) and the comparison to the Sun (right).
How does the star's temperature change over time?
Change the information panel to "brightness."
Click play and observe the movement on the HR Diagram (left) and the comparison to the Sun (right).
How does the star's luminosity changes over time?
Change the information panel to "Stages in your stars life."
Click play and observe the movement on the HR Diagram (left) and the comparison to the Sun (right).
What stages does the star go through over the course of its life?
Change the information panel to "Mass."
Click play and observe the movement on the HR Diagram (left) and the comparison to the Sun (right).
How does the star's mass change over time?
Change the mass size to a 30 solar mass star. (That's 30 times the size of the Sun).
Change the information panel to "Compare the size."
Click play and observe the movement on the HR Diagram (left) and the comparison to the Sun (right).
How the star's radius (size) change over time?
Change the information panel to "Surface temperature."
Click play and observe the movement on the HR Diagram (left) and the comparison to the Sun (right).
How does the star's temperature change over time?
Click play and describe how the star'sChange the information panel to "brightness."
Click play and observe the movement on the HR Diagram (left) and the comparison to the Sun (right).
How does the star's luminosity changes over time? luminosity changes with time.
Change the information panel to "Stages in your stars life."
Click play and observe the movement on the HR Diagram (left) and the comparison to the Sun (right).
What stages does the star go through over the course of its life?
Change the information panel to "Mass."
Click play and observe the movement on the HR Diagram (left) and the comparison to the Sun (right).
How does the star's mass change over time?
Compare and contrast low mass and high mass stars.
Low Mass Star | High Mass Star | Both Low & High Mass Stars | |
|---|---|---|---|
Begins as a hot blue star | |||
Has a shorter life span | |||
Ends as a white dwarf | |||
Ends as a supernova | |||
Begins on the main sequence | |||
Begins as a "Sun" like star | |||
Spends time as a red giant/supergiant before its death | |||
Brighter throughout its life time | |||
Larger overall throughout its lives |
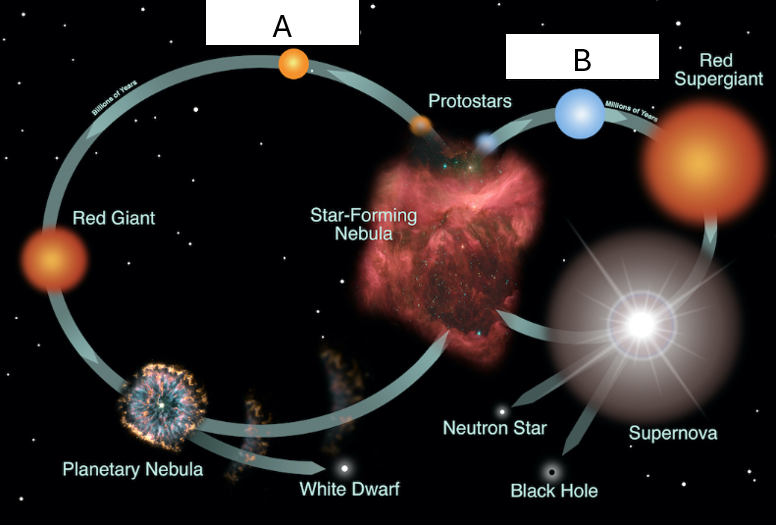
Consider this model of star life cycles:

Which side (A or B) depicts the life cycle of a high mass star?
Which side (A or B) depicts the life cycle of a low mass star?