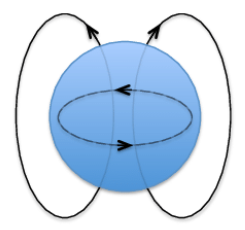
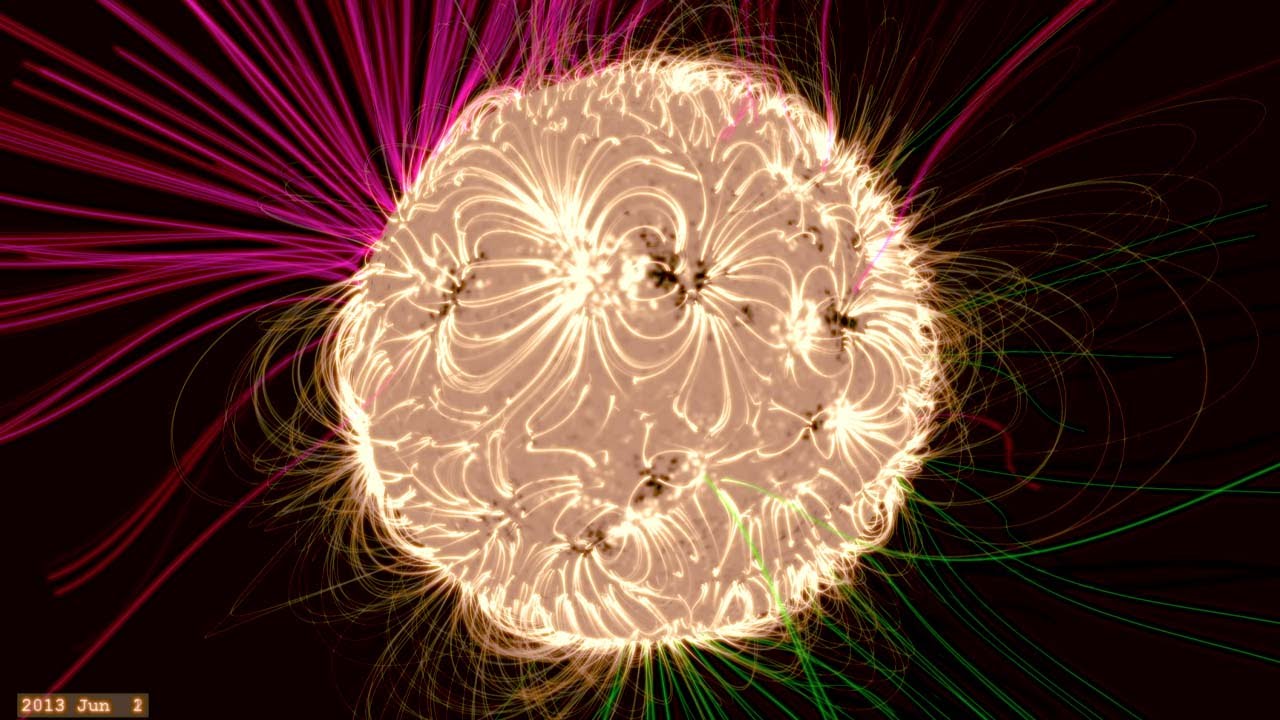
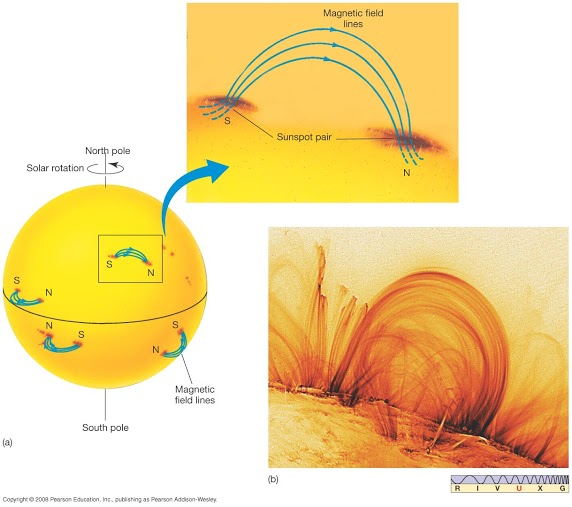
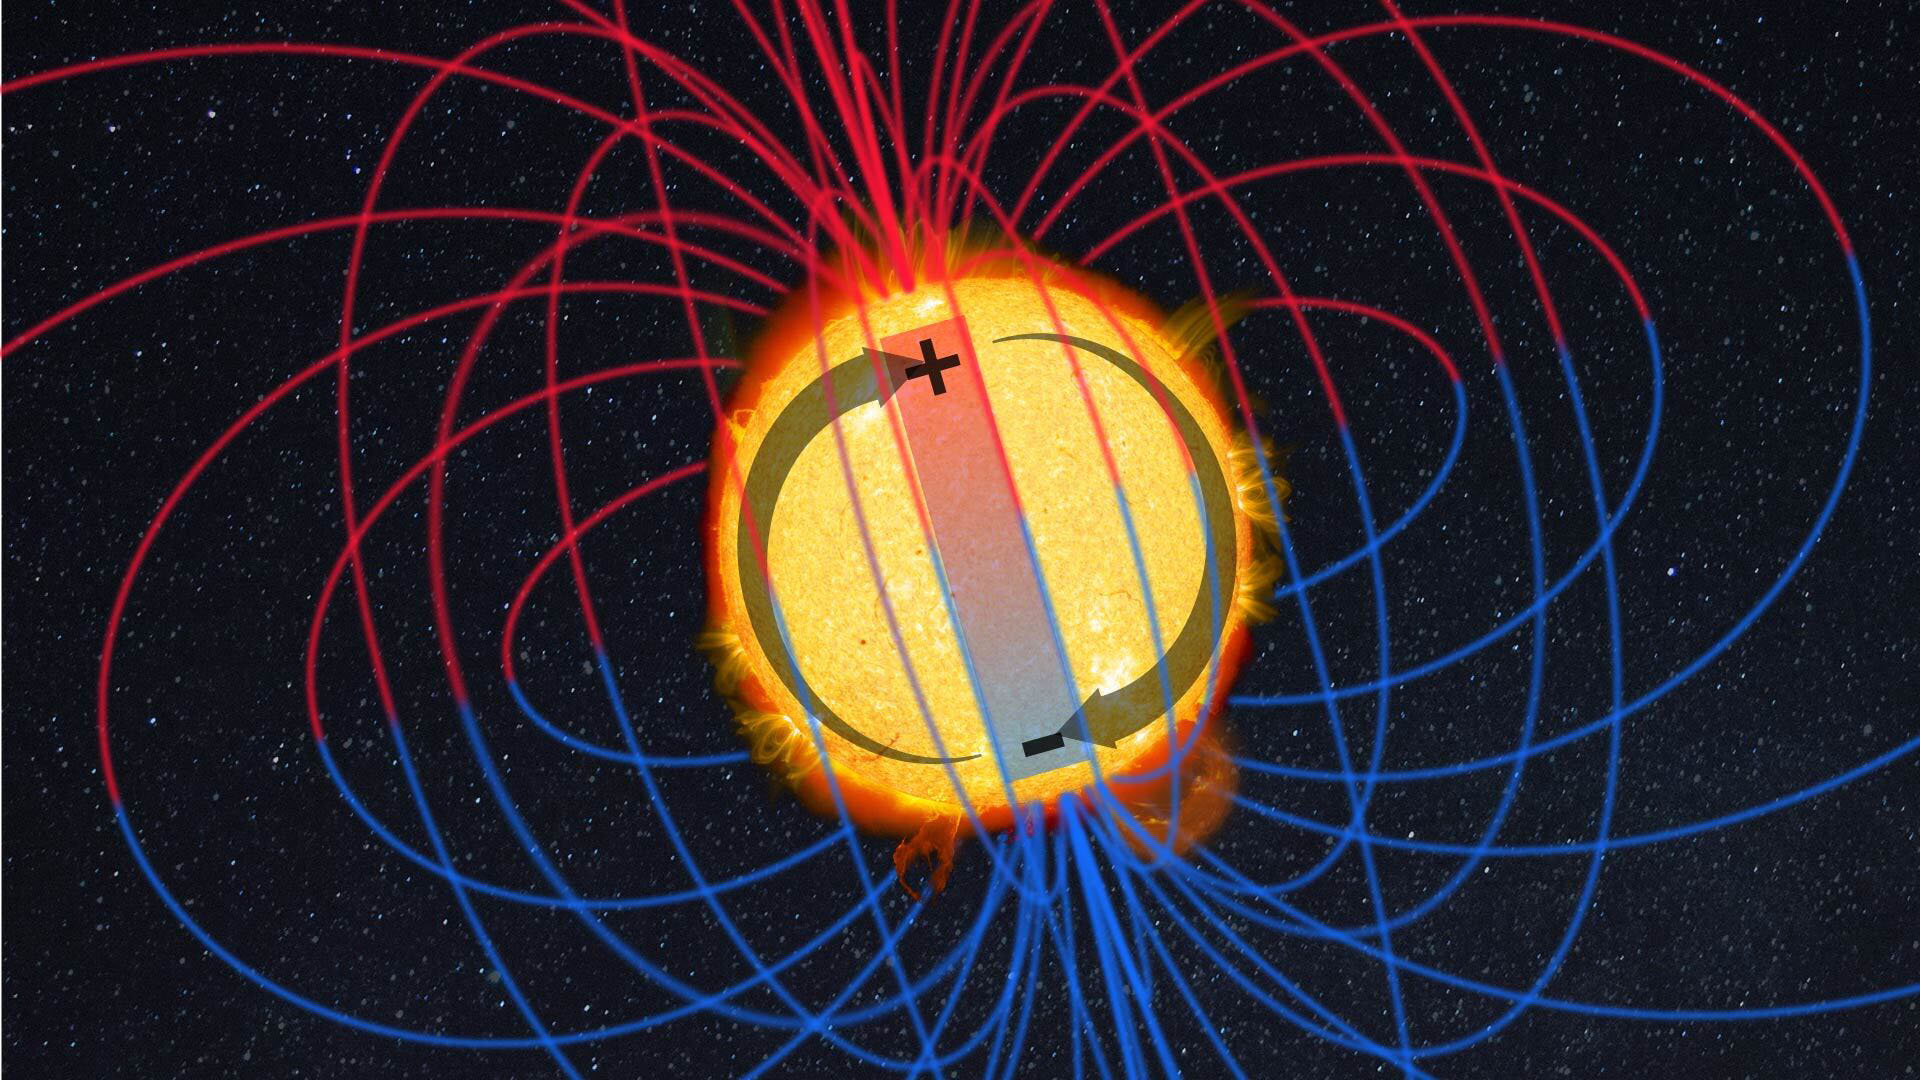
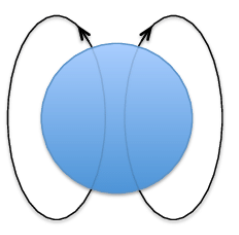
The Sun acts like a giant magnet. It has a magnetic north pole and a magnetic south pole, and invisible magnetic field lines connect the two. These lines come out of one pole, loop through the Sun’s atmosphere, and go back into the other pole.
Here is one way to visualize it:
This is another way to visualize it:
Which statement best describes the Sun’s magnetic field?
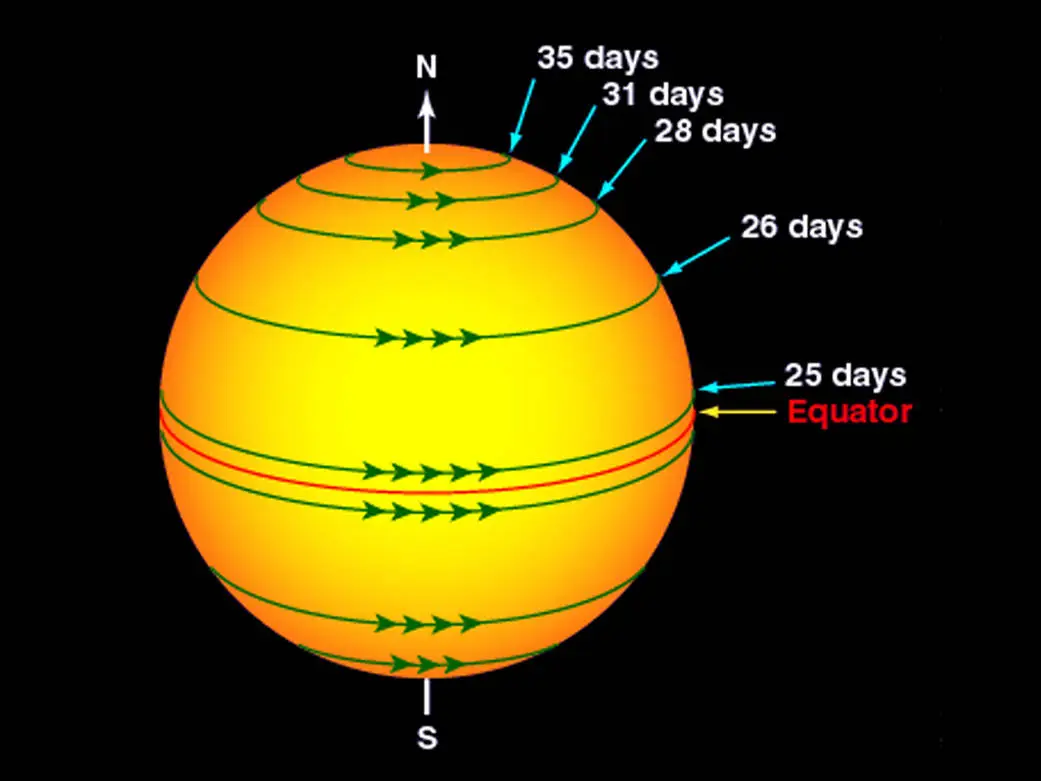
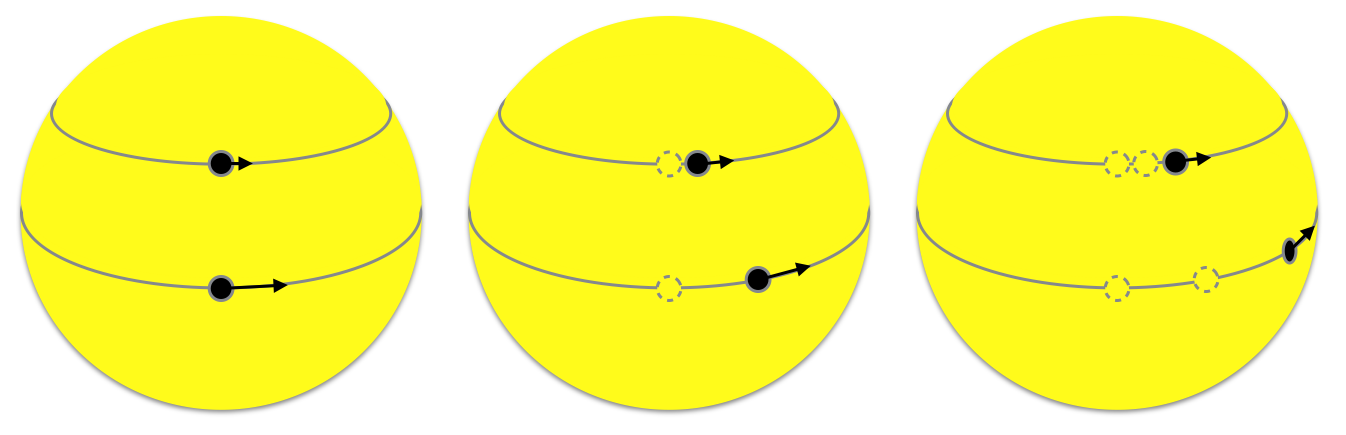
The Sun does not spin like a solid ball. Its equator turns faster than its poles — this is called differential rotation. Because the Sun is made of hot, flowing gas (plasma), different latitudes can rotate at different speeds.
Here is one way to visualize it:

Here is another way to visualize it:

Which statement best explains differential rotation of the Sun?
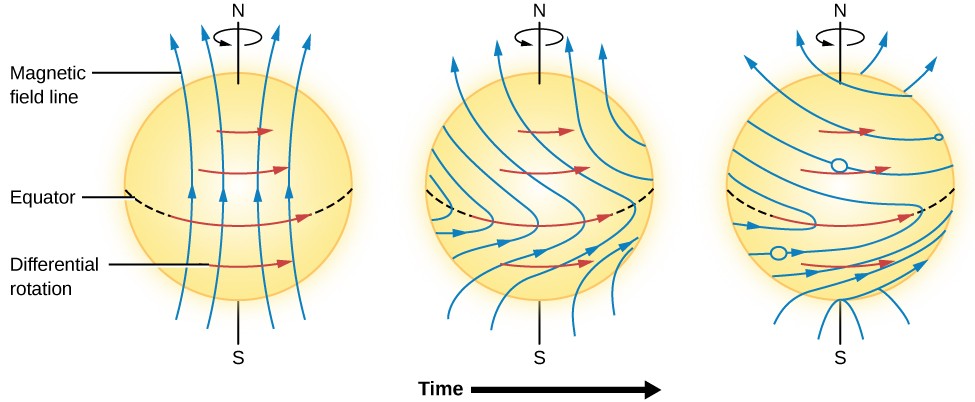
Differential rotation stretches and twists the Sun’s magnetic field lines. Picture drawing a straight line on a rubber ball and then spinning the middle faster than the top and bottom — the line would wrap around the ball. On the Sun, north–south field lines get wrapped into east–west bands. These twisted, concentrated fields can push up through the surface as sunspots and cause more solar activity.
Here's one way to visualize this:

Here's another way to visualize the 2 sets of movement:

Which statement best describes what differential rotation does to the Sun’s magnetic field?
These twisted, concentrated fields can push up through the surface to form sunspots and cause more solar activity.
Here's one way to visualize this:

Here's another way to visualize this:

Which happens when twisted, concentrated magnetic fields push up through the Sun’s surface?
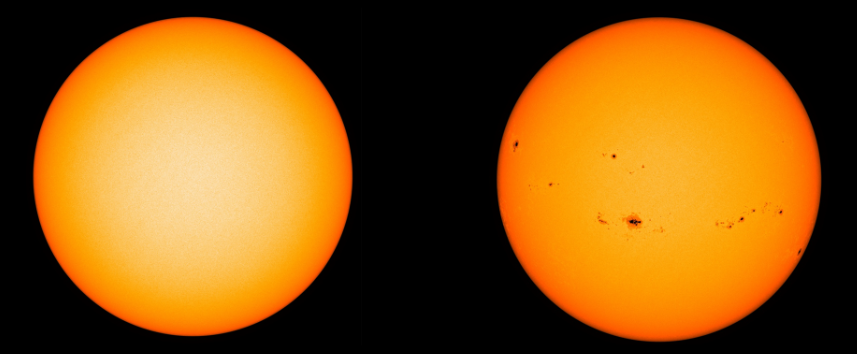
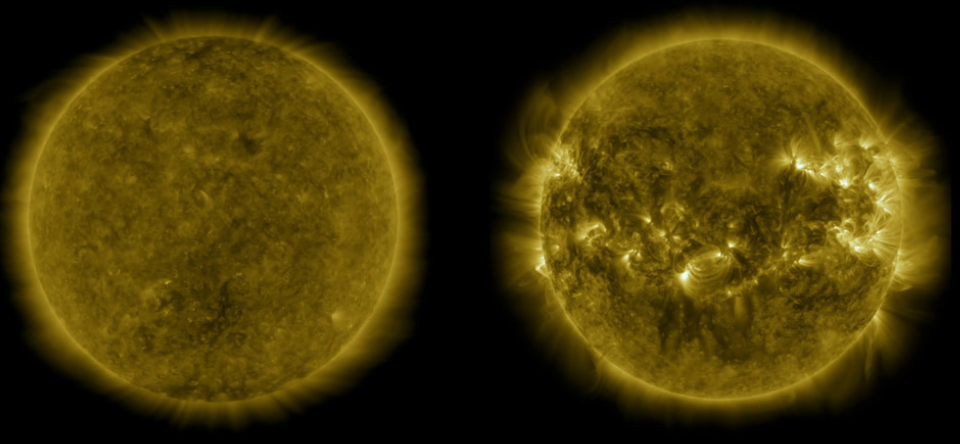
Solar maximum is the term for the period when sunspot counts, solar flares, and overall magnetic activity peak, producing more storms and enhanced space weather.
Solar minimum is the opposite phase, with few sunspots, minimal flaring, and quieter space‑weather conditions.
Compare these visible light images of the Sun. Which one represents each period?

Compare these x-ray images of the Sun. Which one represents each period?

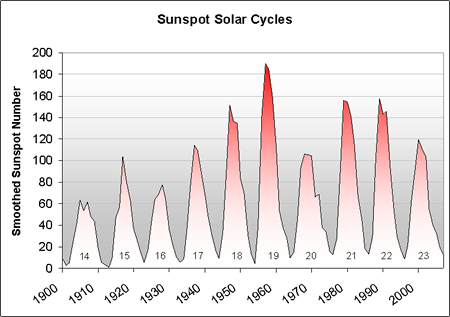
Scientists have been recording the number of sunspots since the mid 1700s! Consider this graph of sunspots since 1900:
Which part of the graph represents solar minimums?
Which part of the graph represents solar maximums?
Based on this data, how long would estimate each solar cycle lasts?
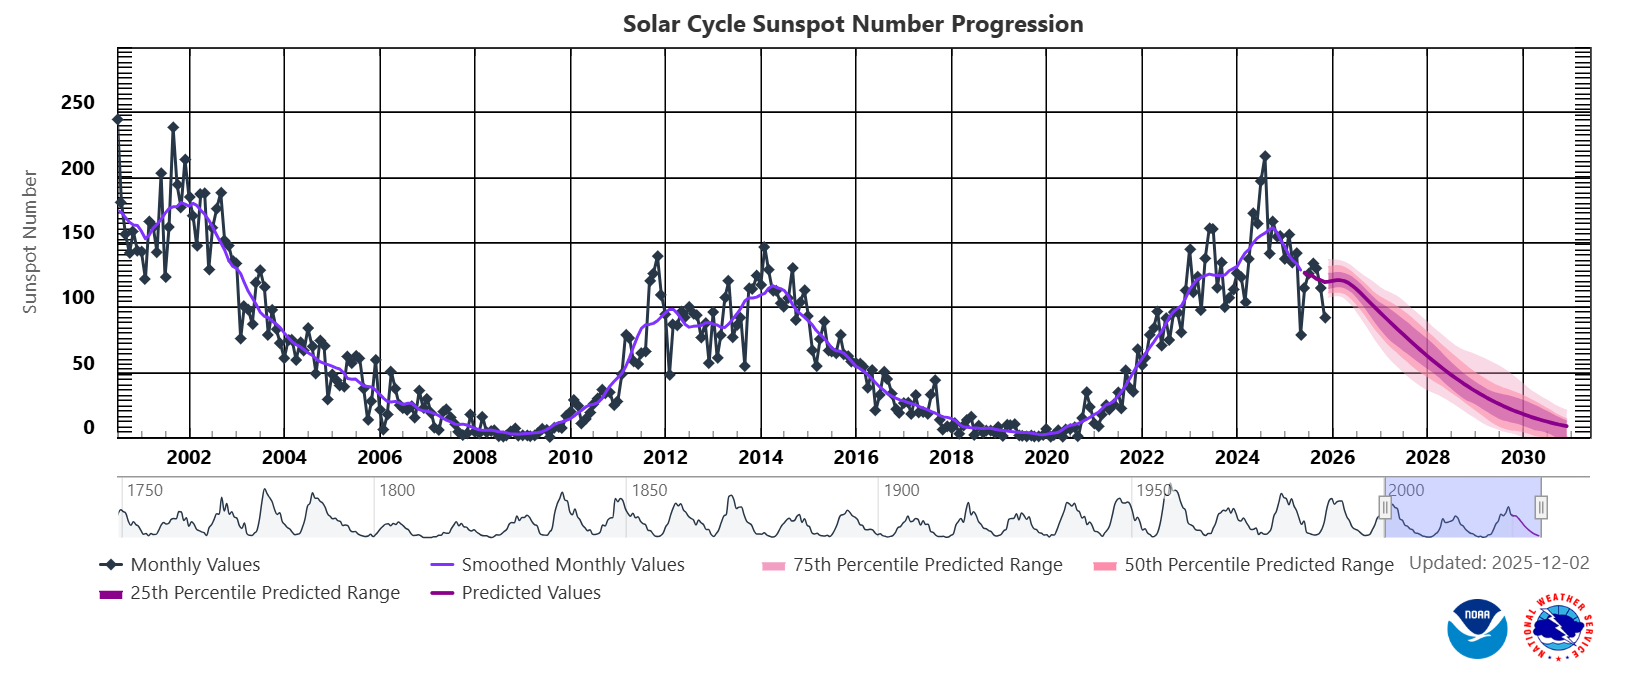
Examine the sunspot data from since 2000. You can view current data here.
On the graph label the last solar maximum, the last solar minimum, and the current solar maximum, as well as next potential solar minimum.

If a solar cycle is 11 years and the next solar minimum will occur in 2032, when can we expect the next solar maximum?
What technique did Koyama use to study the sun during daytime?
Why do sunspots appear darker than surrounding areas on the sun’s surface?
What made counting and tracking sunspots challenging before modern tools?
Why were Koyama’s drawings particularly valuable to researchers?
What long-term impact did Koyama’s consistent drawings have for scientists?
What is the solar cycle?
What do scientists use to track sunspots?
When do sunspots typically peak during the solar cycle?
Which region of the Sun rotates fastest?
What happens to the Sun's magnetic field at the peak of the solar cycle?
What do scientists look for to declare a new solar cycle?
What can strong magnetic fields at the Sun's poles indicate?