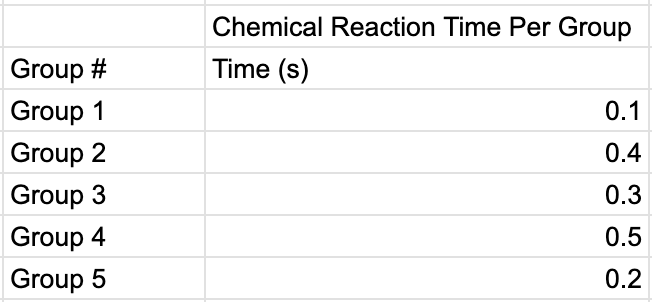
This data table contains the time it took for all of the groups in Period 4 to see a reaction to occur in the Cold Pack section of their Physical & Chemical Changes Lab.
This checkpoint is an opportunity for you to show your knowledge of Chemical Changes, and reading data tables and making graphs based on the Cold Pack Lab you performed in class.
For the first two questions, read them carefully so you understand what is being asked of you.
For the third question, you will be making a bar graph about the data table that shows how long it took for starts to start noticing a chemical reaction in their cold pack bag. Do not forget to include a title, axis labels, and an appropriate scale.
For the final question you are speculating (predicting) why some students had a faster reaction time in their cold pack bag than others. Pick the most likely reason.
To make the cold pack for the Physical and Chemical Changes Lab, the following were mixed in a sealed plastic bag:
3.8 g of citric acid
4.6 g of baking soda
30 g of water
Question:
After the reaction happens, what should the total mass of the liquid inside the bag be?
Was the Cold Pack Lab an example of an Endothermic or Exothermic Reaction? Why?
Use the data table above to draw a Bar Graph (Make sure to include a title, axis labels, and an appropriate scale)
What is most likely the reason why some students saw a reaction sooner than others?