1
Choose the correct statement
x
y
0
-8
2
-3
4
3
9
7
Choose the correct statement
x | y |
0 | -8 |
2 | -3 |
4 | 3 |
9 | 7 |
1
1
1
Choose the correct statement
x | y |
0 | -8 |
2 | -3 |
4 | 3 |
9 | 7 |
Choose the correct transformation for the graph. Let
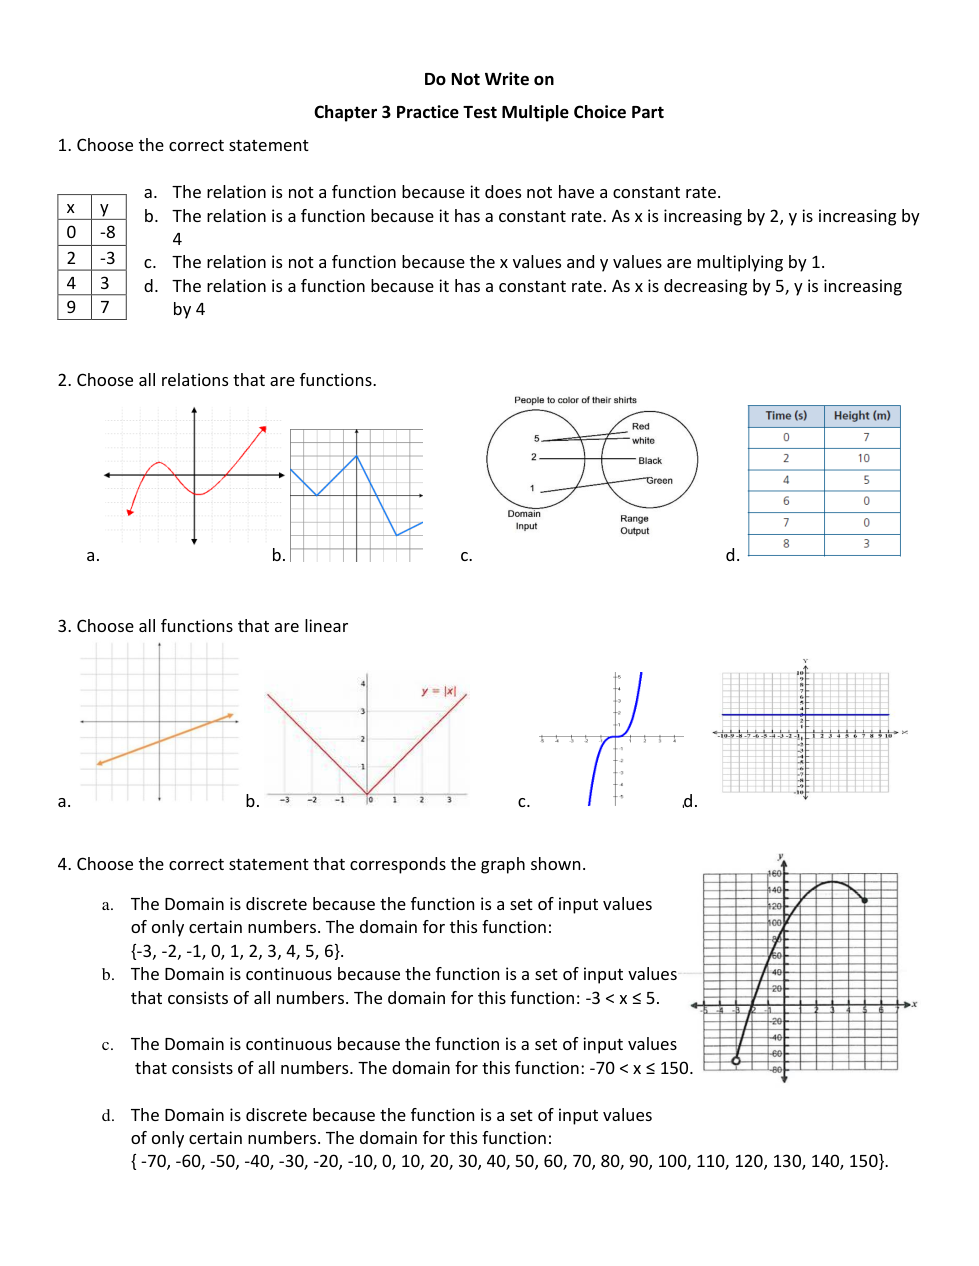
Choose all relations that are functions.
 a.
a. b.
b. c.
c. d.
d.
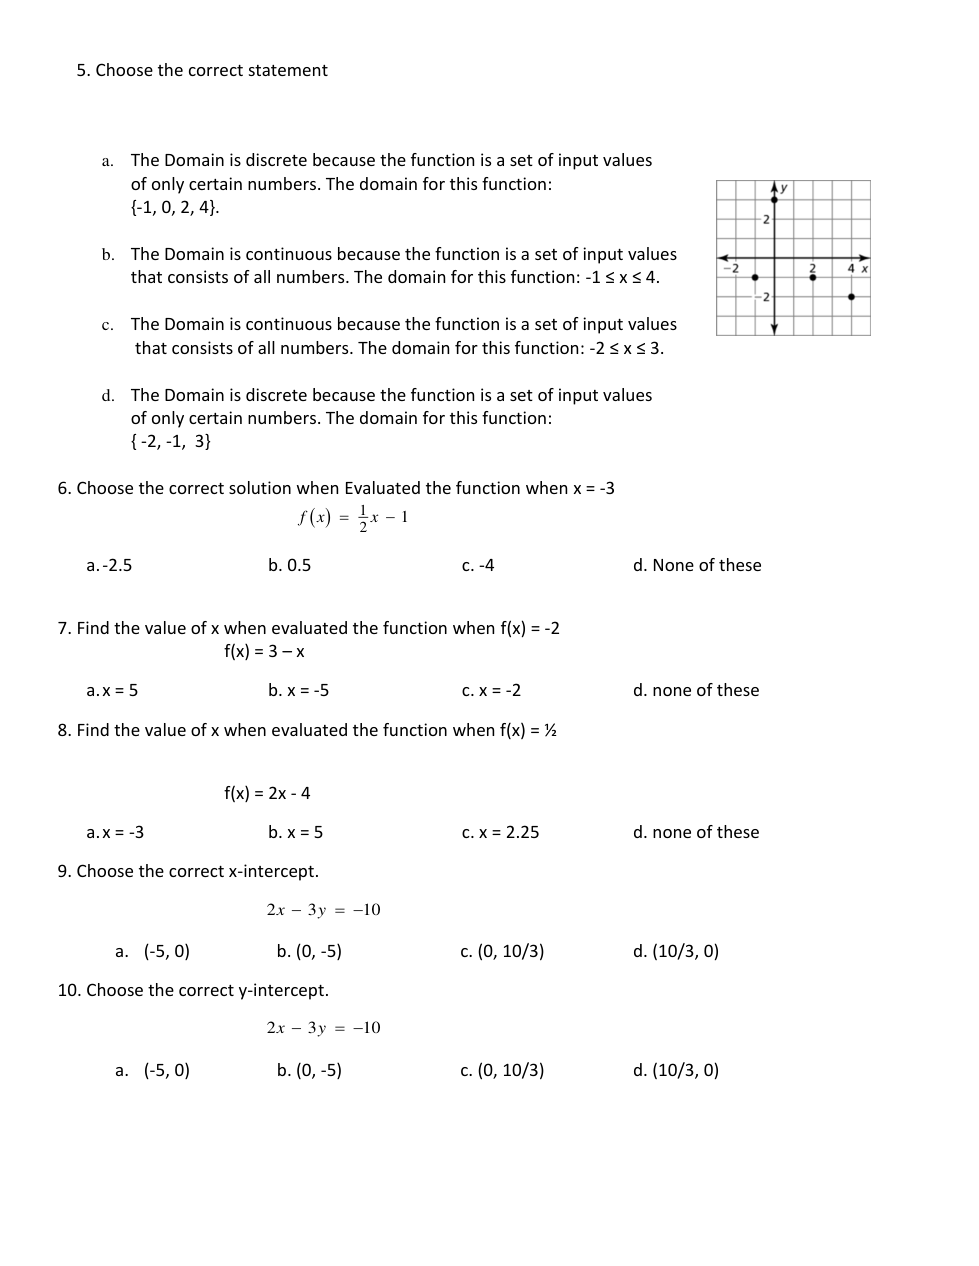
Choose all functions that are linear
 a.
a. b.
b. c.
c. d.
d.
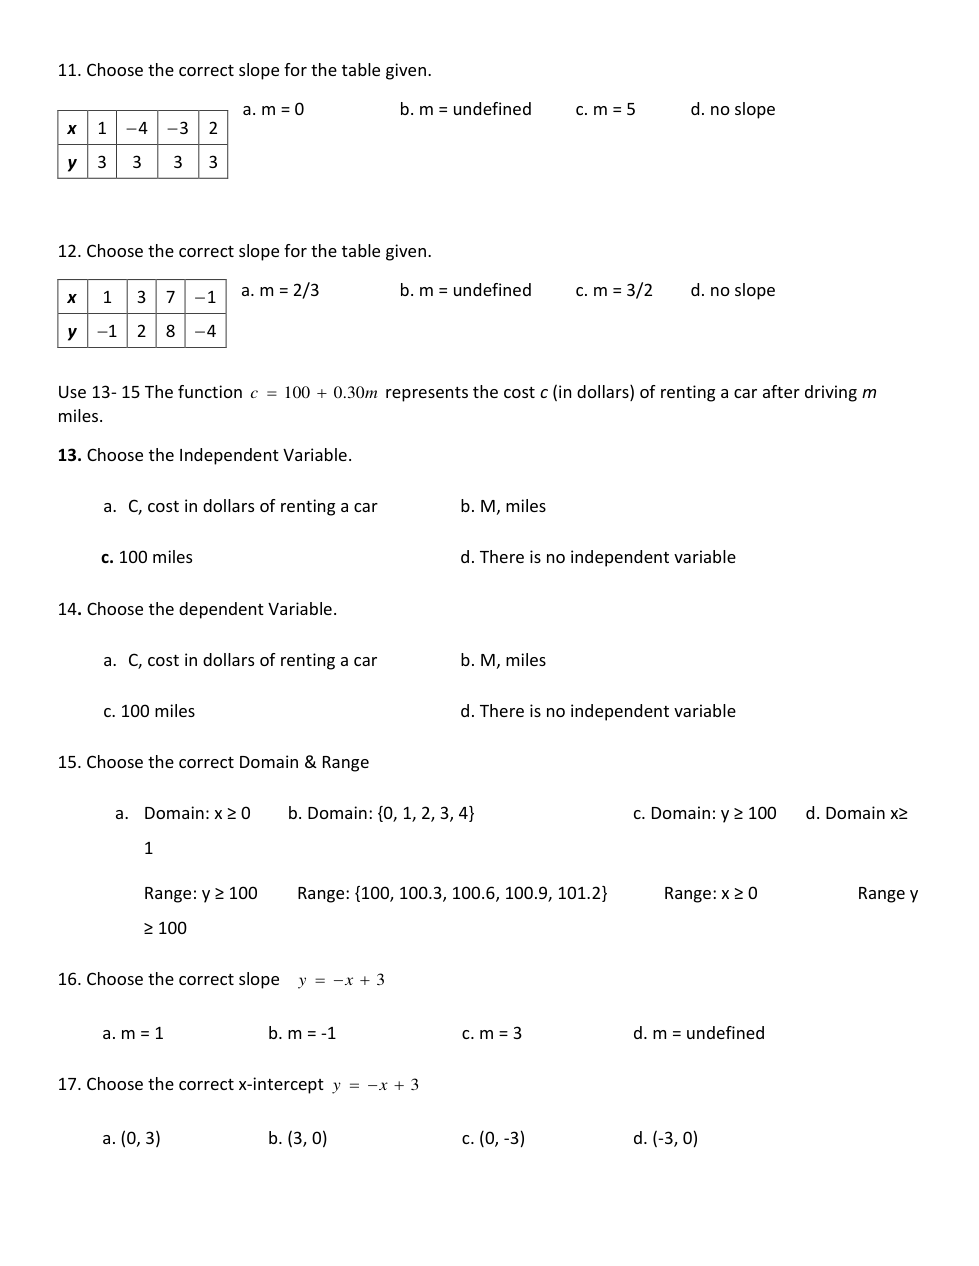
Choose the correct statement that corresponds the graph shown.

Choose the correct statement
Choose the correct solution when Evaluated the function when x = -3
Find the value of x when evaluated the function when f(x) = -2
Find the value of x when evaluated the function when f(x) = ½
Choose the correct x-intercept.
Choose the correct y-intercept.
Choose the correct slope for the table given.
x | 1 | -4 | -3 | 2 |
|---|---|---|---|---|
y | 3 | 3 | 3 | 3 |
Choose the correct slope for the table given.
x | 1 | 3 | 7 | -1 |
|---|---|---|---|---|
y | -1 | 2 | 8 | -4 |
Choose the Independent Variable.
Choose the dependent Variable.
Choose the correct Domain & Range
Choose the correct slope
Choose the correct x-intercept
Choose the Y-intercept
Choose the correct slope
Choose the correct x-intercept
Choose the Y-intercept
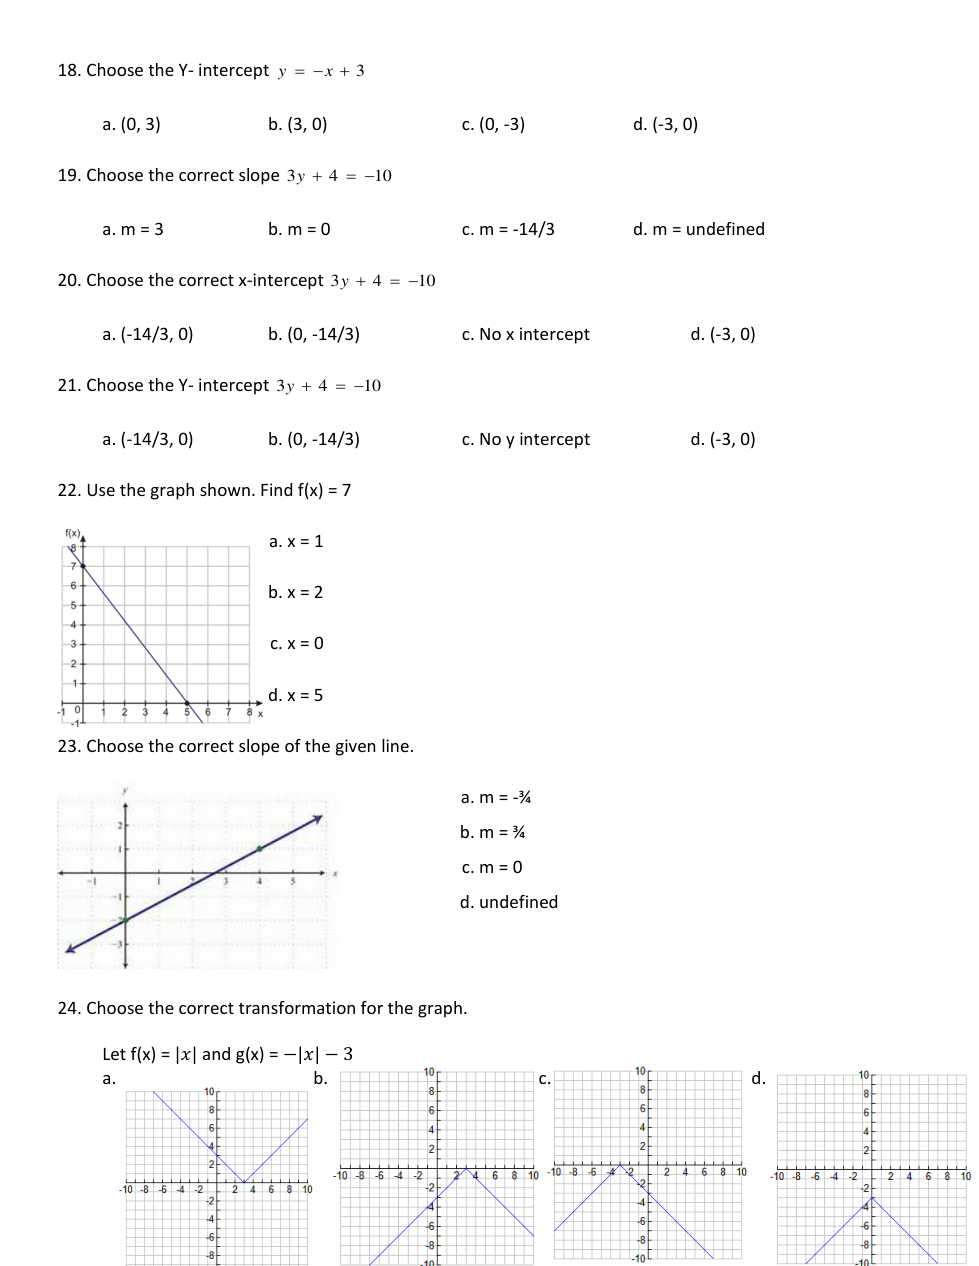
Use the graph shown. Find
Choose the correct slope of the given line.
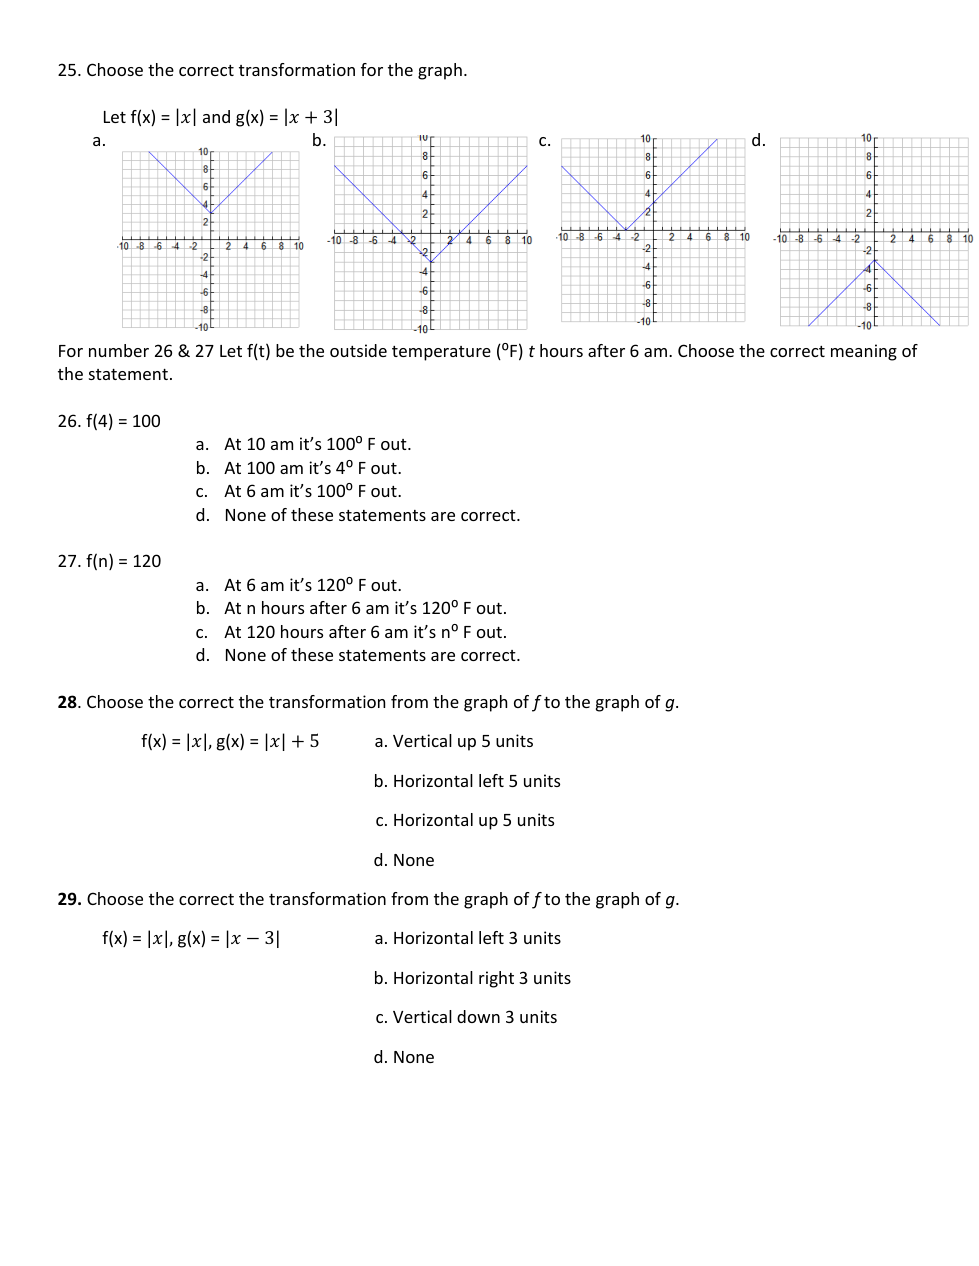
Choose the correct transformation for the graph.
Let
For number 26 & 27 Let
26.
27.
Choose the correct transformation from the graph of
Choose the correct transformation from the graph of
