Math 3-11 Proportional and Nonproportional Relationships
star
star
star
star
star
Posljednje ažuriranje 5 months ago
24 questions
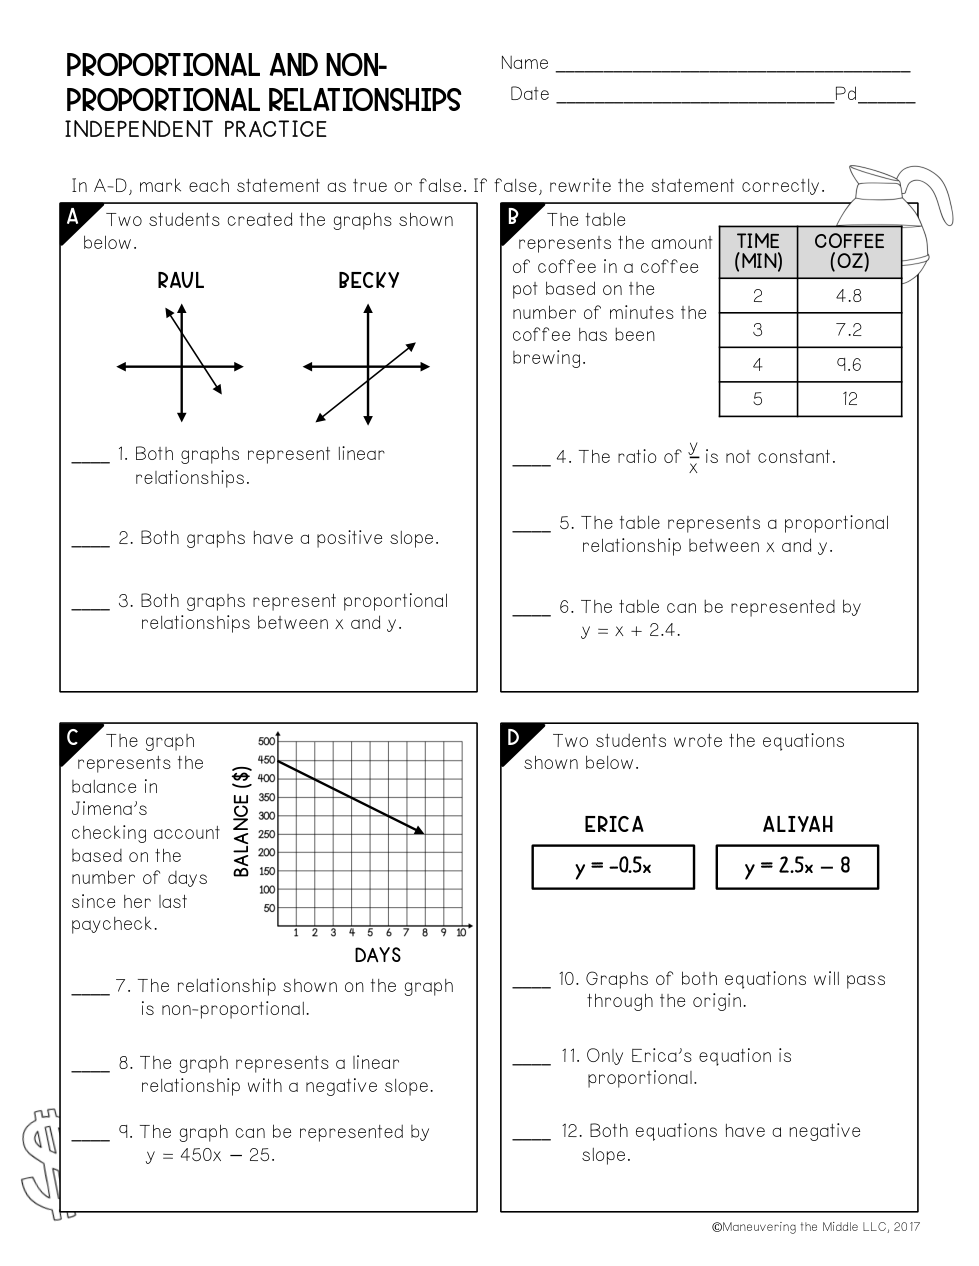
If the answer is true then fill in the blank from the sentence. If the answer is false correct the blank in the sentence.
Both graphs
If the answer is true then fill in the blank from the sentence. If the answer is false correct the blank in the sentence.
If the answer is true then fill in the blank from the sentence. If the answer is false correct the blank in the sentence.
If the answer is true then fill in the blank from the sentence. If the answer is false correct the blank in the sentence.
The ratio of y/x is a constant
If the answer is true then fill in the blank from the sentence. If the answer is false correct the blank in the sentence.
The table represents a
If the answer is true then fill in the blank from the sentence. If the answer is false correct the blank in the sentence.
The table can be represented by
If the answer is true then fill in the blank from the sentence. If the answer is false correct the blank in the sentence.
The relationship shown on the graph is
If the answer is true then fill in the blank from the sentence. If the answer is false correct the blank in the sentence.
The graph represents a linear relationship with a
If the answer is true then fill in the blank from the sentence. If the answer is false correct the blank in the sentence.
The graph can be represented by
If the answer is true then fill in the blank from the sentence. If the answer is false correct the blank in the sentence.
The graph of
If the answer is true then fill in the blank from the sentence. If the answer is false correct the blank in the sentence.
Only
If the answer is true then fill in the blank from the sentence. If the answer is false correct the blank in the sentence.
Only