Use the Graph below for questions 1-6. Ziae and Zadyn went out cycling one day. The graph below shows how far they travelled during their ride.

Use the Graph below for questions 1-6. Ziae and Zadyn went out cycling one day. The graph below shows how far they travelled during their ride.
How far did they travel in total?

How long were they cycling for?

What was their average speed for the whole journey? Show your working.
What was their speed from point A to point B? Show your working.
What was their speed from point B to point C? Show your working.
During what part of the journey was Ziae and Zadyn stationary?
Use the image and information in the graph for questions 7-11

Use the Position-Time graph describe the black car's motion from 0-3 seconds:
Use the Position-Time graph describe the black car's motion from 3-5 seconds:
Use the Position-Time graph to answer: Does the black car's speed change from 0-3 seconds:
Use the Position-Time graph to answer: Does the black car's velocity change from 3-5 seconds:
Use the Position-Time graph describe the blue car's motion from 3-5 seconds
Below is a graph showing the motion of a person.

What is the person doing from A to B?
Below is a graph showing the motion of a person.
What is the person doing from E to F?
Below is a graph showing the motion of a person.
What is the person doing from B to C?
Below is a graph showing the motion of a person.
at what point he person is moving with a fast cosntant speed ?
What does it mean if an object is traveling a constant speed?

Using the graph, what can you tell about Runner #1 (BLUE LINE)?
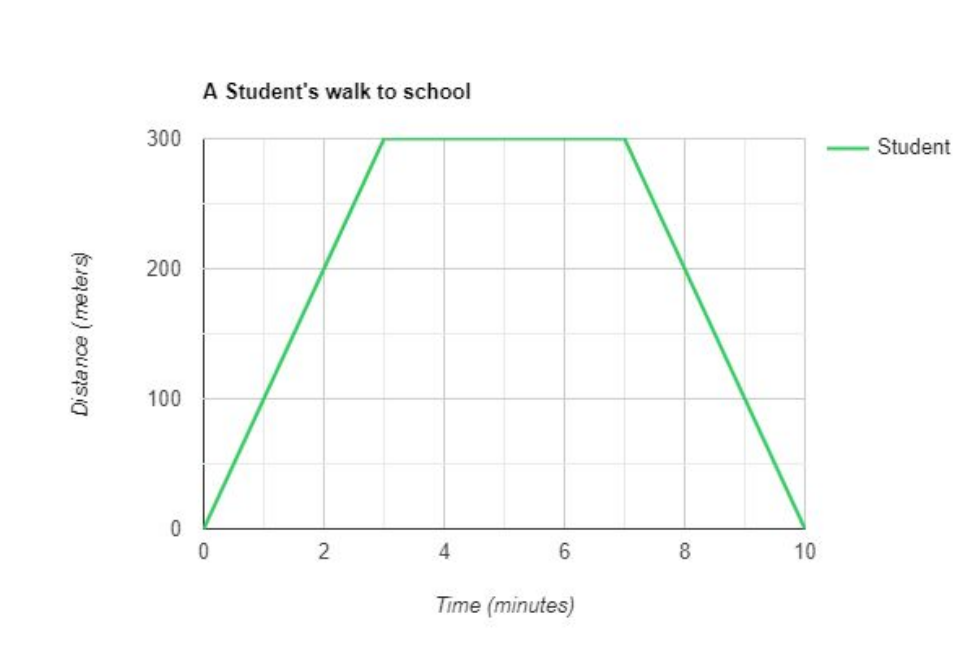
Using the graph, what can be determined about the student's walk to school between 3 minutes and 7 minutes?
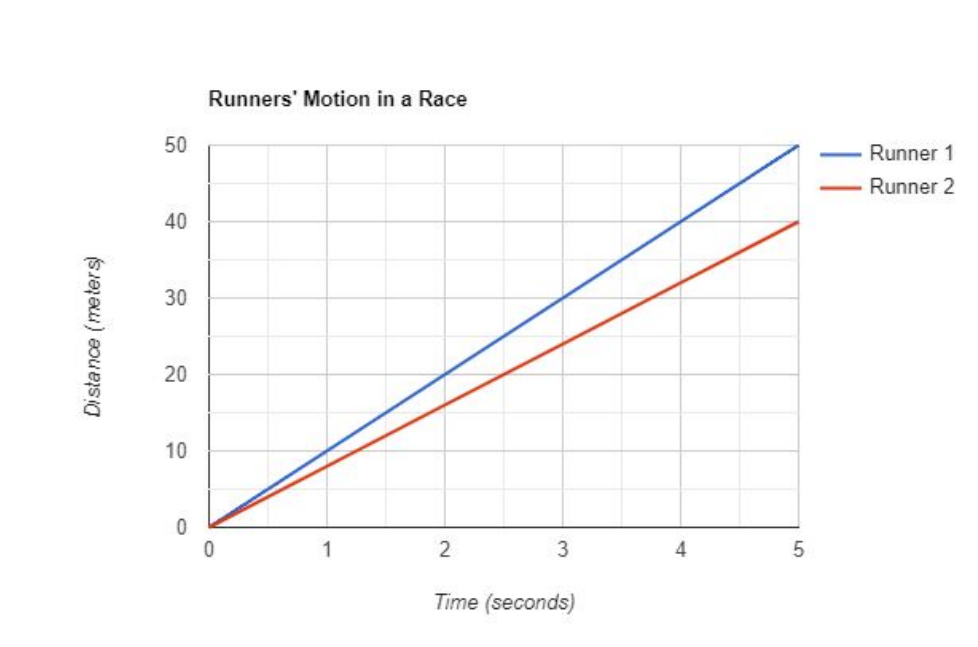
Using the graph, how can you comapre the two runners?
Using the graph, what can you tell about Runner #2 (RED LINE)?
