The area of a trapezoid is given by the formula
, where
What is the height of a trapezoid with an area of
The Exam is not limited to the Focused IPQs questions, so please revise this and then go back and review the desmos questions
Which equation represents this sentence?
Four times the sum of a number x and a number y is equal to 25.
Match each equation to its verbal description.
The product of three and the sum of x and y is equal to six. _____
The product of three times x and y is equal to six. _____
The sum of three times x and y is equal to six. _____
The sum of three and the product of x and y is equal to six. _____
Write an equation to represent this sentence.
The difference of twice x and four times the quantity x plus y is equal to ten.
Write an equation for the below sentence.
Three added to four times a number n is the same as 19.
Write a sentence for the equation:
Write a sentence for the below equation.
Write a sentence for the equation:
Solve the equation:
Solve each equation:
Solve each equation:
Solve each equation:
Solve
Solve
, forSolve
Identify the term that best describes each equation
One Solution
No Solution
Infinitely Many Solutions
Which of the following linear equations has no solution?
Which of the following linear equations has infinitely many solutions?
Solve the equation for
Solve the equation for
Solve the equation for
Solve
, forSolve the equation:
.Solve
. Select all that apply.Which of the following, if any, is/are the solution(s) for the equation
?Solve the equation
. Show you checked your solutions.Solve the equation
. Show you checked your solutions.Solve the equation
. Show you checked your solutions.Solve the equation for
Solve the equation for
Which of the below is the solution to
?Which of the below is the solution to
?Solve
Solve the equation
forSolve
, forThe base of a triangle,
Find the height of the triangle,
(Hint: Area of a triangle is
)The area of a trapezoid is given by the formula
, where
What is the height of a trapezoid with an area of
The chart shows common household conversions:

Choose the correct unit so that the value is equivalent to
If
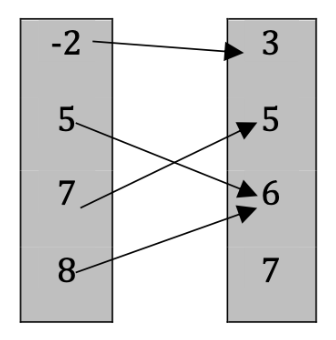
Which relation is a function?
Which relation is NOT a function?
What is the range of the relation below?
Identify the domain of the relation.
Identify the range of the relation.
Is the relation a function? Explain
Complete the table for the function
.Graph
using theSultan has
What an equation that relates the number of pounds of pretzels
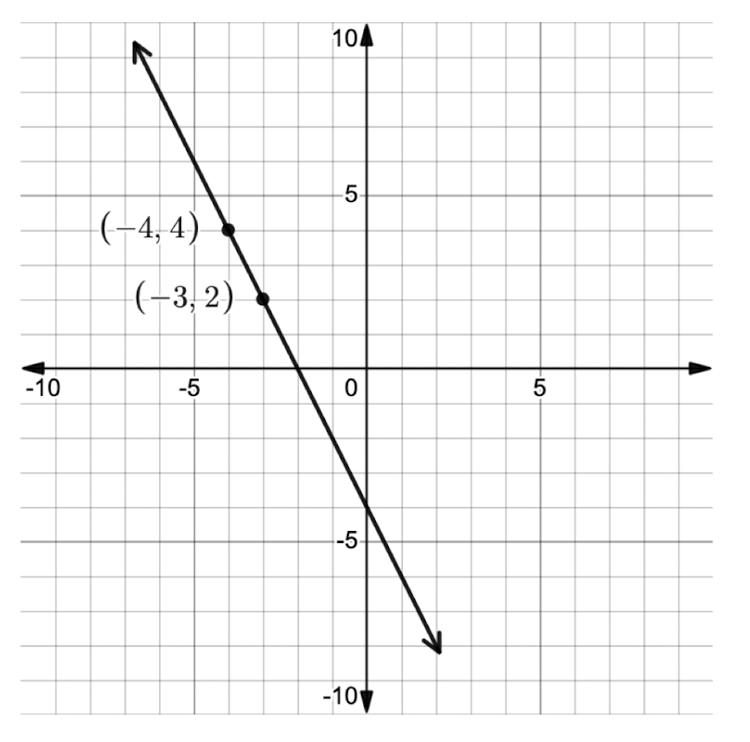
The slope of a line that passes through
Which pair(s) of points form a line with a negative slope? Select all that apply.
The slope of a horizontal line is
Given a line that passes through the points
Find the slope of the line.
Find the value of
Find the value of
What is the equation, in slope-intercept for of the linear function
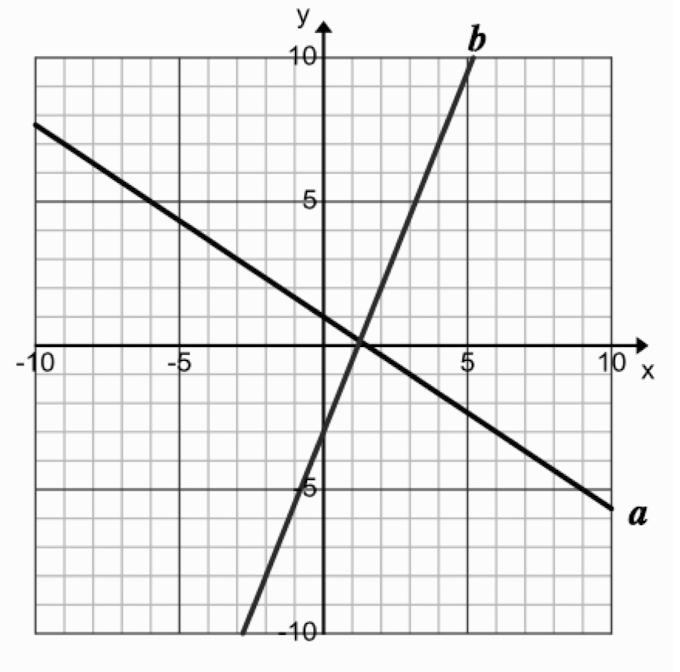
Refer to the line graphed, and find the slope.
Refer to the line graphed, and find the y-intercept.
Refer to the line graphed, and find the equation of the line.
Match the linear function with the correct description of how its graph differs from the parent graph.
| Stavka koja se može prevući | arrow_right_alt | Odgovarajuća stavka |
|---|---|---|
| arrow_right_alt | reflected across x-axis and stretched vertically | |
| arrow_right_alt | reflected across y-axis and compressed horizontally |
Match the linear function with the correct description of how its graph differs from the parent graph.
| Stavka koja se može prevući | arrow_right_alt | Odgovarajuća stavka |
|---|---|---|
| arrow_right_alt | The graph of the parent function stretched vertically and reflected across the x-axis. | |
| arrow_right_alt | The graph of the parent function compressed horizontally and reflected across the y-axis. | |
| arrow_right_alt | The graph of the parent function translated 5 units left and 5 units up. | |
| arrow_right_alt | The graph of the parent function translated 5 units right. |
Determine the type of transformation in each function as it relates to the parent function.
Translation
Dilation
Reflection
Describe the transformation in
Select all the transformations in
Describe the transformation in
Determine whether each sequence is an arithmetic sequence.
Arithmetic Sequence
Not an Arithmetic Sequence
Determine whether each of the below sequences is arithmetic or not. Select Yes or No.
Yes, an arithmetic sequence | No, not an arithmetic sequence | |
|---|---|---|
Determine whether or not each sequence is an arithmetic sequence. If it is, give the
common difference,
Determine whether or not each sequence is an arithmetic sequence. If it is, give the
common difference,
Determine whether or not each sequence is an arithmetic sequence. If it is, give the
common difference,
Determine whether or not each sequence is an arithmetic sequence. If it is, give the
common difference,
Determine whether or not each sequence is an arithmetic sequence. If it is, give the
common difference,
Fill in the values to make an arithmetic sequence:
Select the graph of

Graph the function
Find its domain and range
Joey wants to rent a surfboard. The cost is
Which graph represents this situation?
Select the graph of
Given the function
Make a table of the graph.
Graph the function
State the domain and range
Which equation represents a line passing through the point
Which equation represents a line that passes through the points
Determine the slope, m, and y-intercept, b, of a line that passes through the points
m=
A health club has a monthly membership fee of AED
Write an equation that represents the total cost,
A movie theater sells popcorn in a reusable bucket for
Write an equation in slope-intercept form to model the cost in dollars,
Which equation represents a line that passes through the points
Which equation represents a line passing through the points
Which shows the equation
written in standard form?Write the equation of the line represented by
in standard form.Write y
Write the below equation in standard form
Write the equation in slope-intercept form of the line that is parallel to the graph of
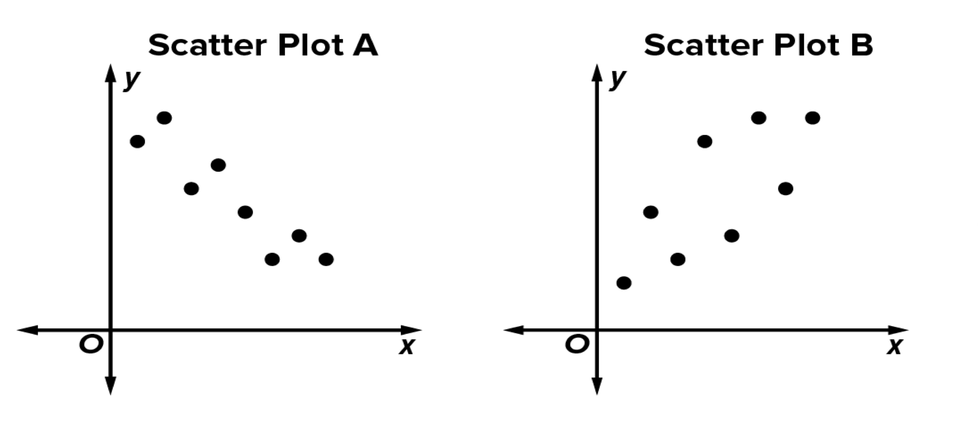
Scatter plot A
Match each scatter plot to its description
| Stavka koja se može prevući | arrow_right_alt | Odgovarajuća stavka |
|---|---|---|
| arrow_right_alt | No correlation |
| arrow_right_alt | Negative correlation |
| arrow_right_alt | Positive correlation |
Match the scatter plot to its description
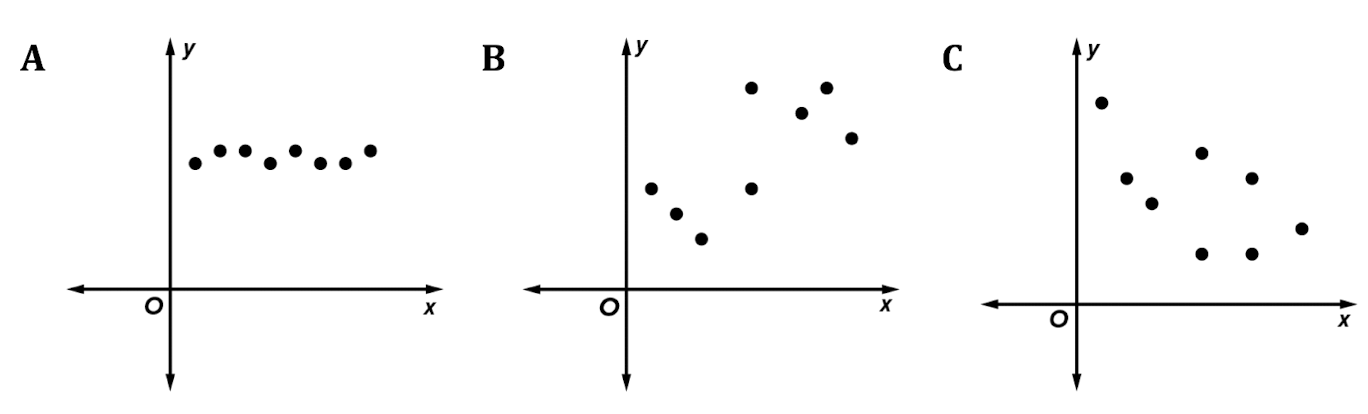
Positive Correlation
Negative Correlation
What is the approximate slope of the line of best fit of the scatter plot?
The scatter plot shows the number of workers employed in the rail transportation industry from 1990 to 1997 according to the Bureau of Economic Analysis The scatter plot shows .
The number of employees was generally
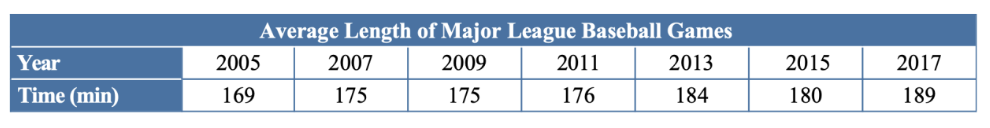
Make a scatter plot and draw a line of fit.
If
represents the number of years since 2005, then year 2005 is represented by and year 2020 is represented by .Find two points that are on the line of fit and use them to find the equation of the line of fit.
Two points on the line of fit are
Correlation and Causation | Correlation but not Causation | Neither | |
|---|---|---|---|
A student created a scatter plot comparing height and shoe size for students in his school. The data show an increasing trend. | |||
A student created a scatter plot comparing shoe size and grade point average. The data showed a random arrangement of points. | |||
A study found no noticeable relationship between the number of hours students spend exercising and student grades | |||
Jamal noticed that his favorite baseball team was more likely to win when he wore a certain hat. | |||
A study found there is a positive correlation between weekly time spent studying and grade point averages. |
For eight weeks, a student kept track of the time he spent studying each week and his weekly algebra quiz scores. He then plotted the variables on a scatter plot and noticed that the points generally fell along a straight line.
What typr of relationship most likely exists between the two variables?
A study of 100 randomly selected students from first through sixth grade finds a strong correlation between overall fitness and participation in sports.
Can you conclude that participation in a sport causes students to be more fit?
Why or Why not?
A salesperson at a department store notices a strong negative correlation between the daily sales of raincoats and swimsuits.
To increase the number of swimsuits sold, he believes that the store should stock fewer raincoats.
Is this reasonable?
Why or Why Not?
This table defines a relation. Which table shows the inverse of the relation?
These ordered pairs define a function:
Select all ordered pairs that are in the inverse of the function
Find the inverse of the relation
Which function is the inverse of
?Find the equation of the inverse of
Which of the following represents the inverse of
?Using the graph of
, what is ?Which is the solution set of
?Solve
Solve
Solve
Which is the solution set of
?Select all the possible solutions of
.Which of the given inequalities is the solution to the graph below?
Draw a graph to represent the solution set of
.Solve the compound inequality
orThe compound inequality
Solve it
Graph it
Solve
The compound inequality
Solve it
Graph it
Solve the absolute value inequality
Solve it
Graph it
Graph the equation using the
Scatter plot B


