Copy of Copy of Unit 3, Lesson 3 (Representations of Linear Relationships) (1/22/2025) (11/21/2025)
star
star
star
star
star
Posljednje ažuriranje 5 months ago
11
What is the slope of the table?
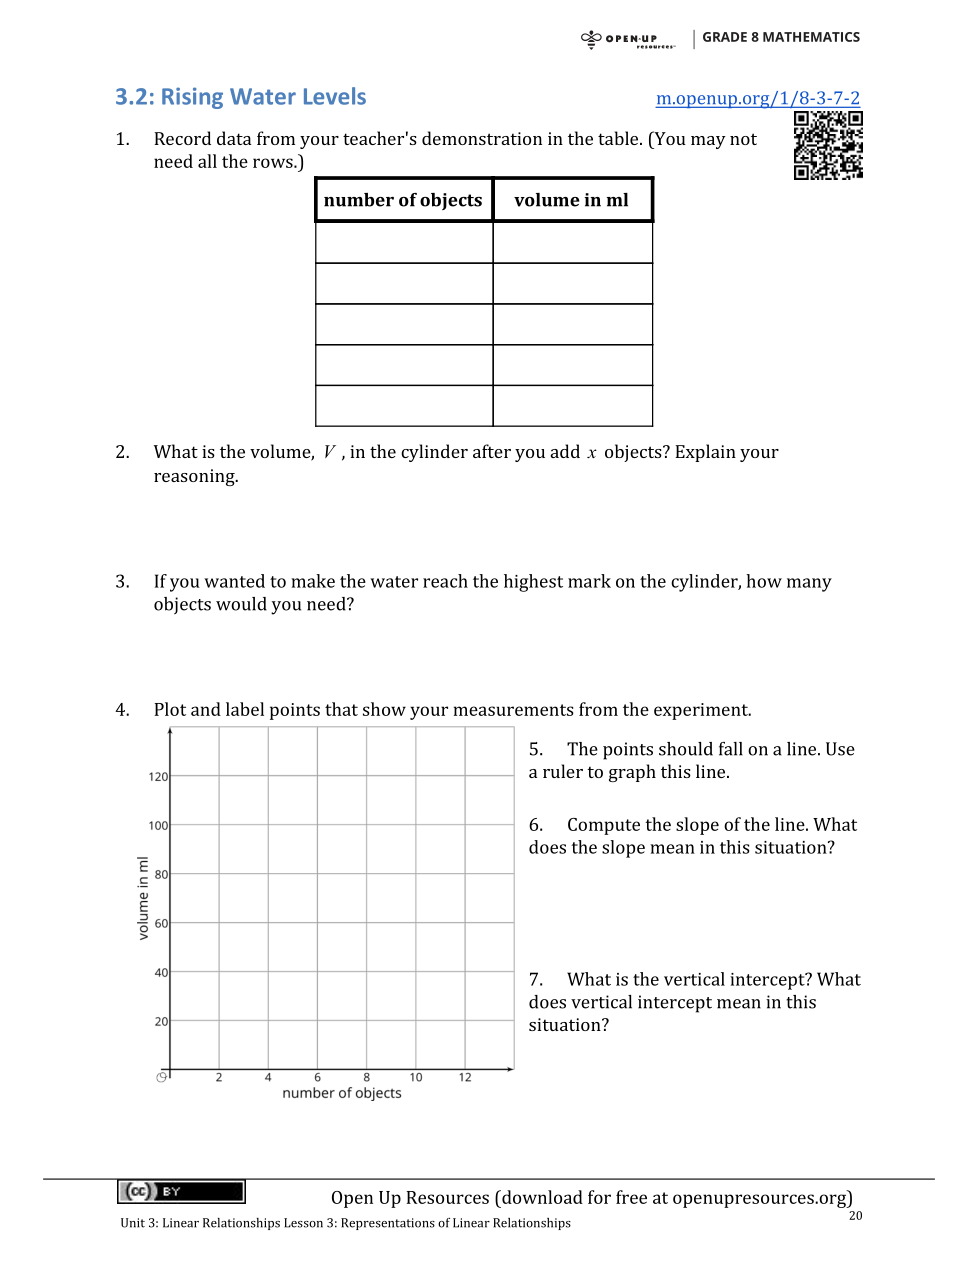
Plot the points from the table. GPOT
Calculate the slope of the line.

Calculate the slope of Graph A.
Calculate the slope of Graph B.
Calculate the slope of Graph C.
Calculate the slope of the line
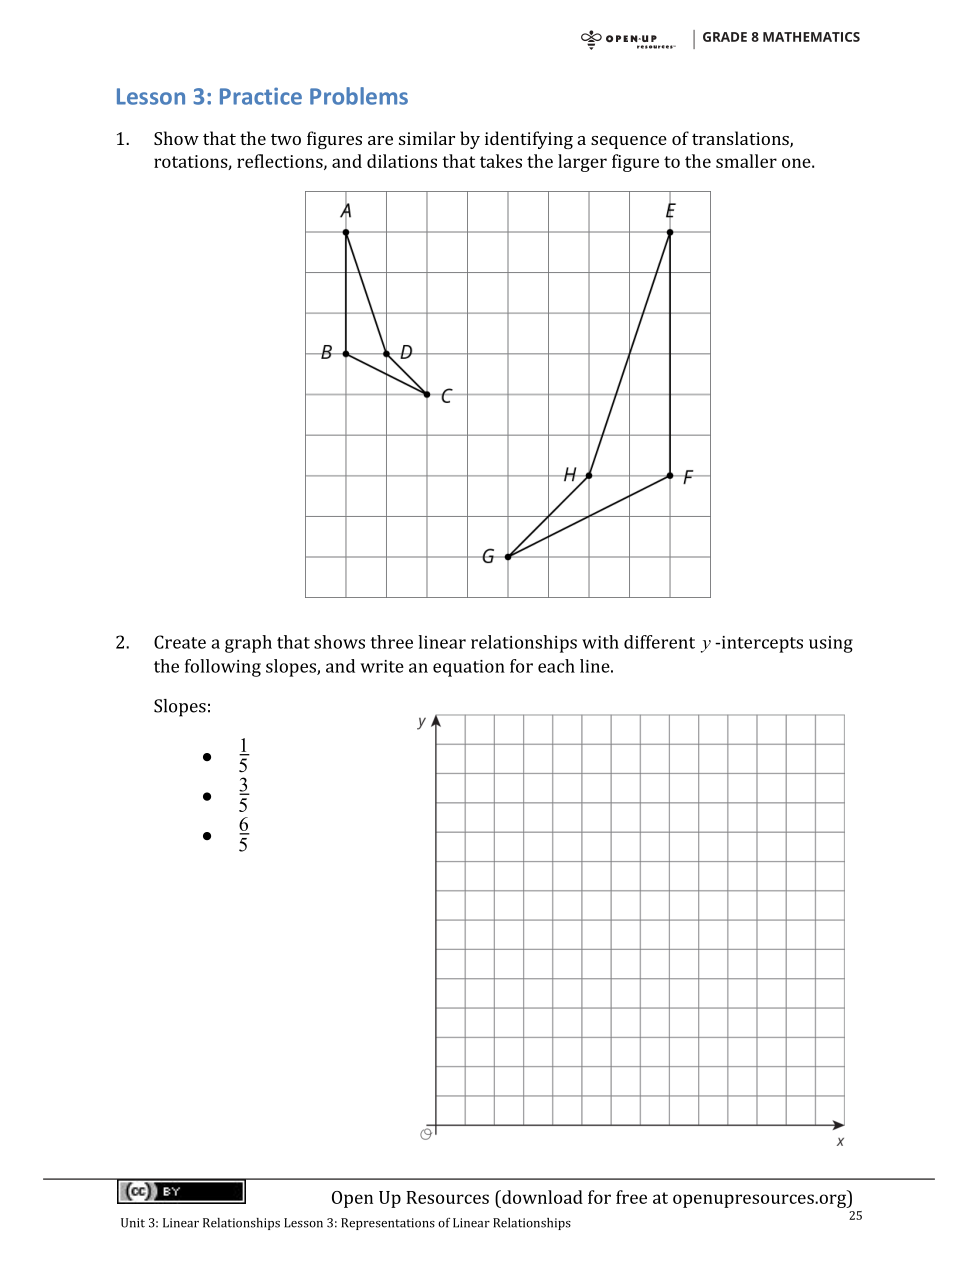
Write an equation for one of the lines you made.
Sample Answer: (y = mx + b)
Make 3 different lines with the three different slopes given.