Copy of Copy of Test - Unit 3 Mid Unit Assessment (Modified) (1/22/2025) (11/21/2025)
star
star
star
star
star
Posljednje ažuriranje 8 months ago
12
1
1
Write an equation that models the linear relationship in the table.
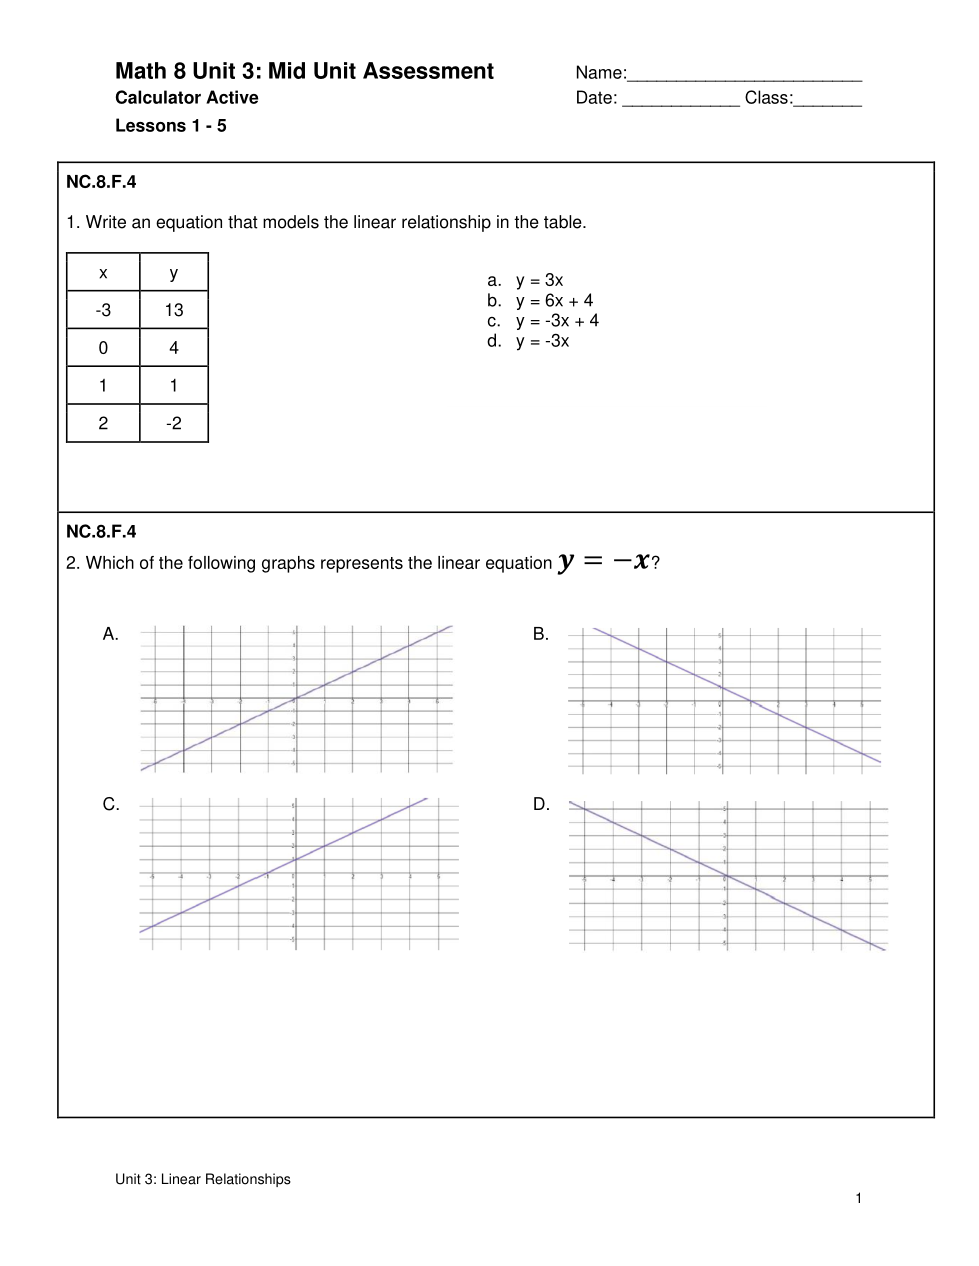
Which of the following graphs represents the linear equation y = -x
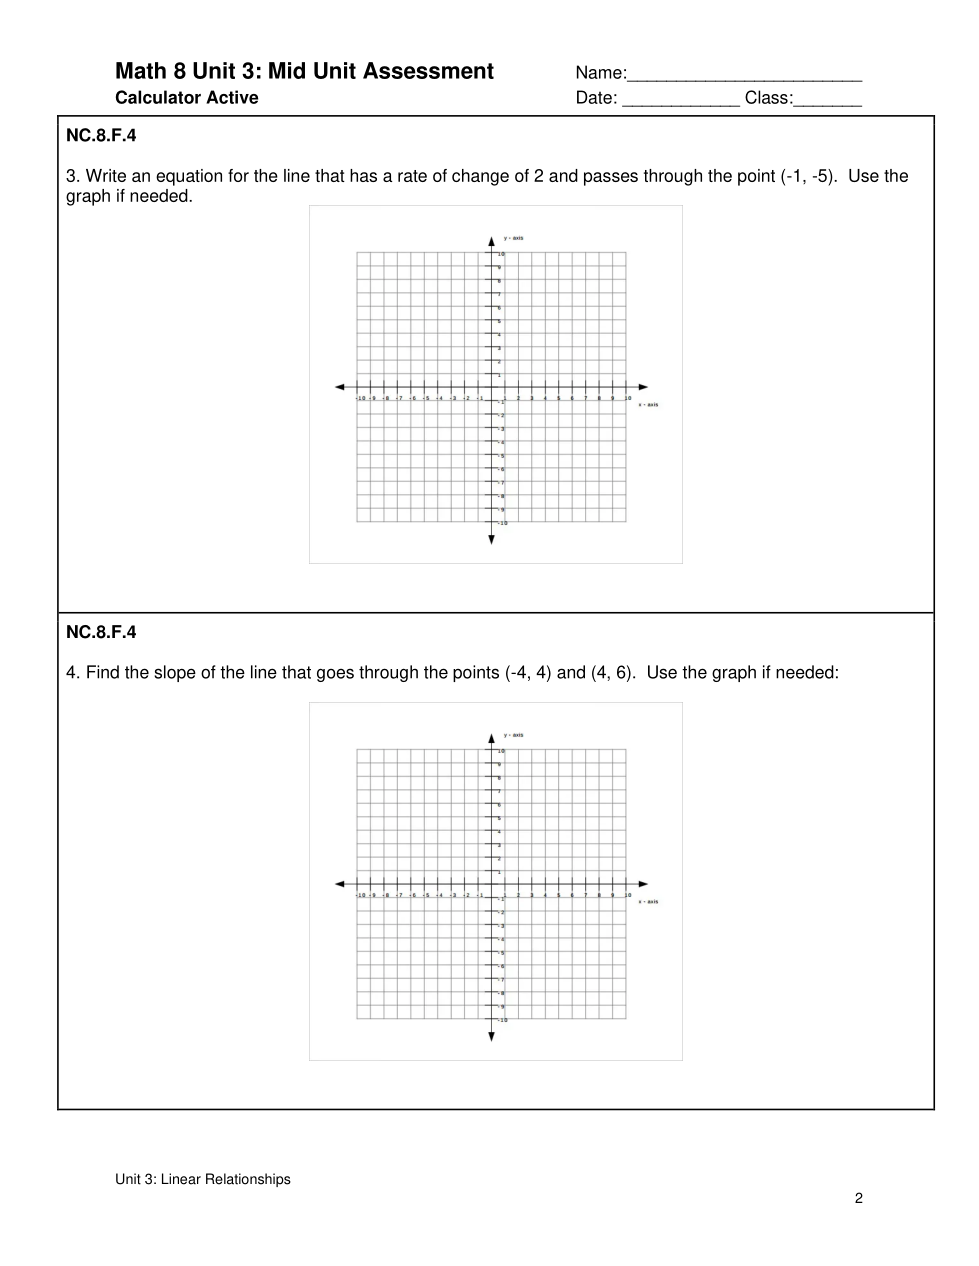
Write an equation for the line that has a rate of change of 2 and passess through the point (-1, -5).
Use the graph if needed.
Hint: Make a Table
Find the slope of the line that goes through the points (-4, 4) and (4, 6).
Use the graph if needed.
Hint: Make a Table
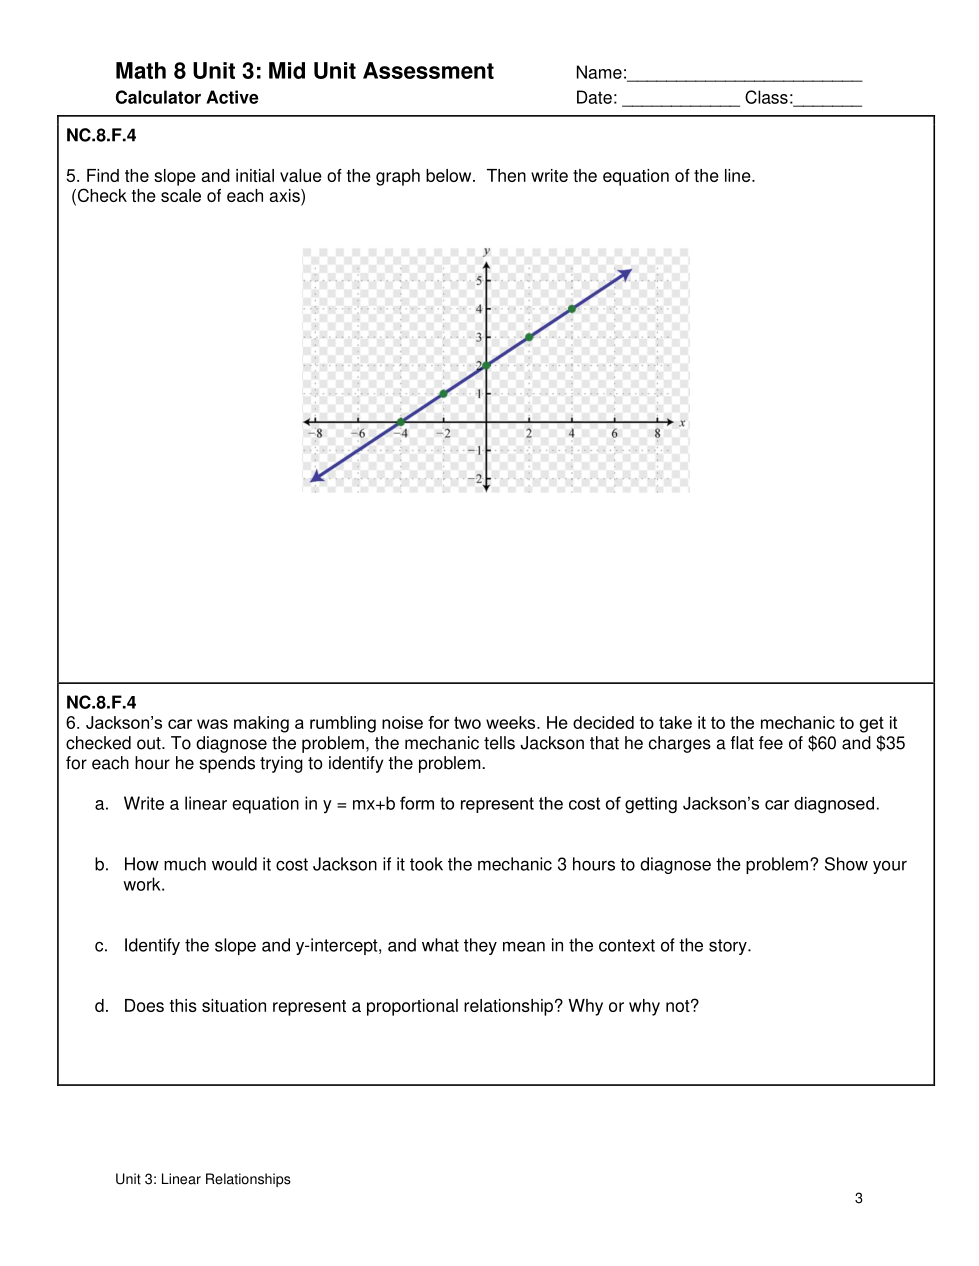
What is the Slope of this graph?
What is the y-intercept 's ordered pair (Intial Value) of this graph?
Using your information from #5 and #6,
What is the equation for this graph?
Write a linear equation in y = mx + b form to represent the cost of getting Jackson's car diagnosed.
How much would it cost Jackson if it took the mechanic 3 hours to diagnose the problem?
Identify the slope and what it means in the context of the story.
Identify the y-intercept and what it means in the context of the story.
Does this situation represent a proportional relationship?
Hint: Make a Table with "x" hours and "y" dollars.