Twa kɔ nsɛm atitiriw so
Log in
Sign up for FREE
arrow_back
Laabri

5.03 Nova Sun Lab MOD 25-26

star
star
star
star
star
Last updated about 1 month ago
17 Nsɛmmisa
Ɛhia
1
Ɛhia
1
Ɛhia
1
Ɛhia
1
Ɛhia
2
HS-ESS1-1
Ɛhia
2
Ɛhia
0
Ɛhia
2
Ɛhia
0
Ɛhia
2
Ɛhia
0
Ɛhia
2
Ɛhia
0
Ɛhia
2
Ɛhia
0
Ɛhia
0
Ɛhia
4
HS-ESS1-1
Asemmisa {{asɛmmisaAhyɛnsode}}
1.

Part 1: Solar Cycle

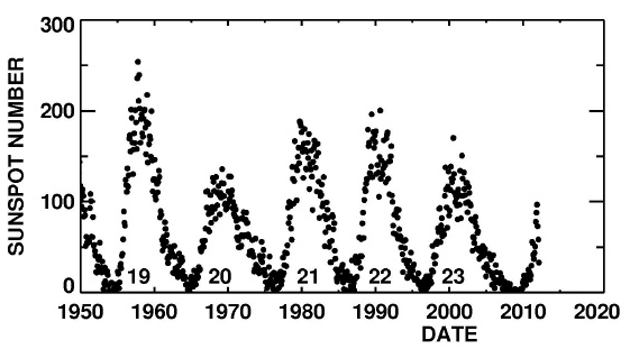
The centuries-old technique of counting sunspots is still one of the simplest and most reliable ways to estimate the level of solar activity.

A small number of sunspots signifies a quiet Sun, while many suggest high levels of activity and the potential for solar storms.

What indicates high levels of solar activity and the potential for solar storms?

Asemmisa {{asɛmmisaAhyɛnsode}}
2.

To estimate sunspot numbers, count sunspot groups and the individual spots within them. Observers, instruments, and weather cause variation, so scientists include a scaling factor k in the official formula—but assume k=1 here. so you can ignore it.

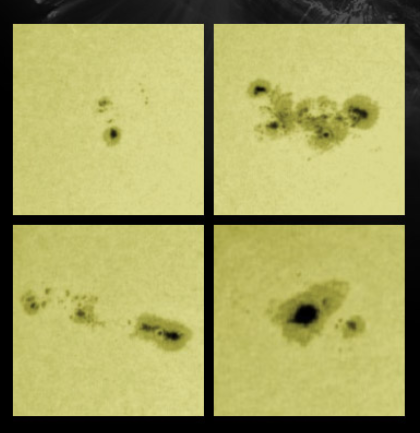
Where does one spot or group end and another begin? Take a look at the image below for clues and then try one yourself.
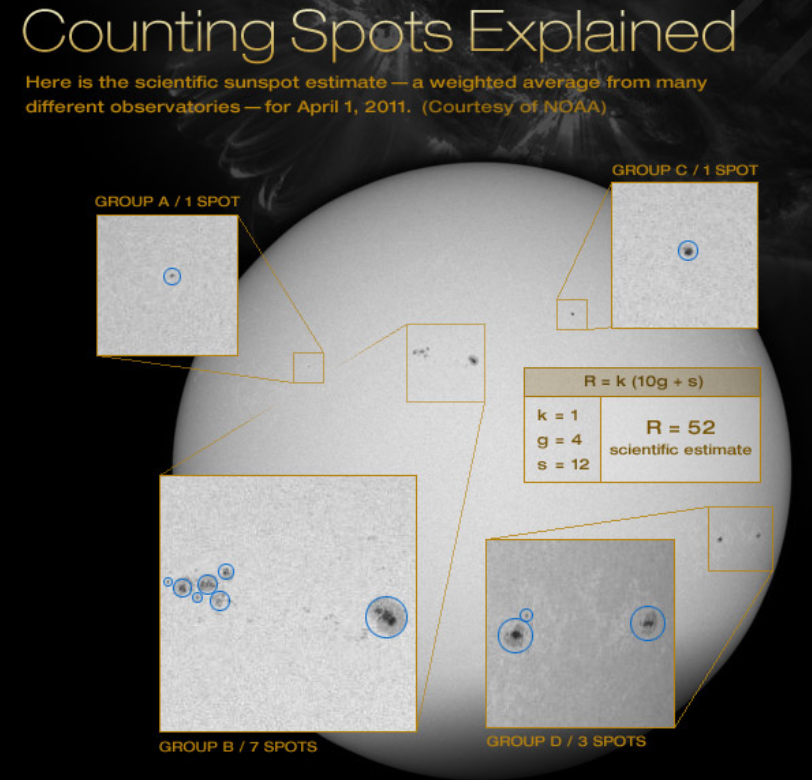
What two counts are needed to estimate the sunspot number?
Asemmisa {{asɛmmisaAhyɛnsode}}
3.

Which issue makes counting sunspots and groups challenging?

Asemmisa {{asɛmmisaAhyɛnsode}}
4.

Observe this data table:

Date

Sunspot Number

December 2010

22

March 2011

31

July 2011

54

October 2011

69

January 2012

97

From December 2020 to January 2012, the number of sunspots

Asemmisa {{asɛmmisaAhyɛnsode}}
6.

Part 2: Storm Prediction

Huge Spots

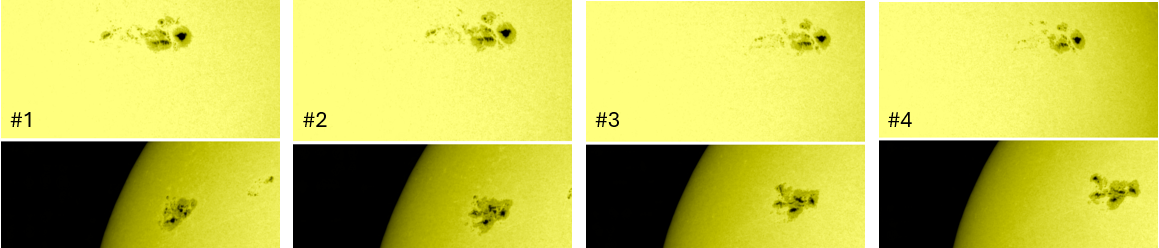
Sunspot size indicates local magnetic-field strength because fields disrupt surface plasma to form spots. Larger spots mean stronger fields and generally higher potential for solar storms.

The larger the sunspot, the its potential for generating solar storms.

Asemmisa {{asɛmmisaAhyɛnsode}}
7.

Compare region A (top) and region b (bottom) and the changes that occur over 4 images.

Which region do you think is most likely to flare?

Asemmisa {{asɛmmisaAhyɛnsode}}
8.

Complicated Spots

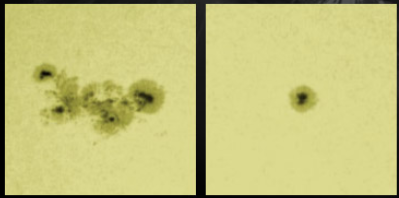
Sunspot size hints at storm potential, but complexity matters too. Highly complex groups (left) are more flare-prone than simple groups (right).

Which are more likely to produce flares?

Asemmisa {{asɛmmisaAhyɛnsode}}
9.

Compare region A (top) and region b (bottom) and the changes that occur over 5 images.

Which region do you think is most likely to flare?

Asemmisa {{asɛmmisaAhyɛnsode}}
10.

Rapid Growth

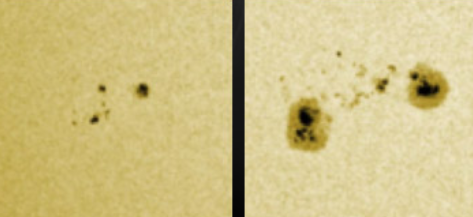
One of the clearest signs of a powerful magnetic field just under the Sun's surface is a sunspot region that grows very rapidly. Sometimes, these grow from nothing to larger than the diameter of Earth in less than a day.

Which is a sign of a strong magnetic field?

Asemmisa {{asɛmmisaAhyɛnsode}}
11.

Compare region A (top) and region b (bottom) and the changes that occur over 5 images.

Which region do you think is most likely to flare?

Asemmisa {{asɛmmisaAhyɛnsode}}
12.

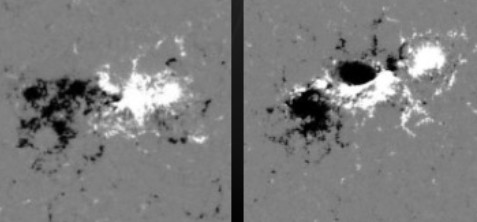
Mixed-up Magnetic Fields

When magnetic fields in an active region become mixed, the potential for solar storms increases. These two magnetogram images identify positive magnetic fields (pointed outward, toward the viewer) in white and negative fields (pointed inward, toward the center of the Sun) in black.

The image on the right is clearly more mixed than the image on the left and has more potential to produce flares or CMEs.

What do mixed up magnetic fields indicate?

Asemmisa {{asɛmmisaAhyɛnsode}}
13.

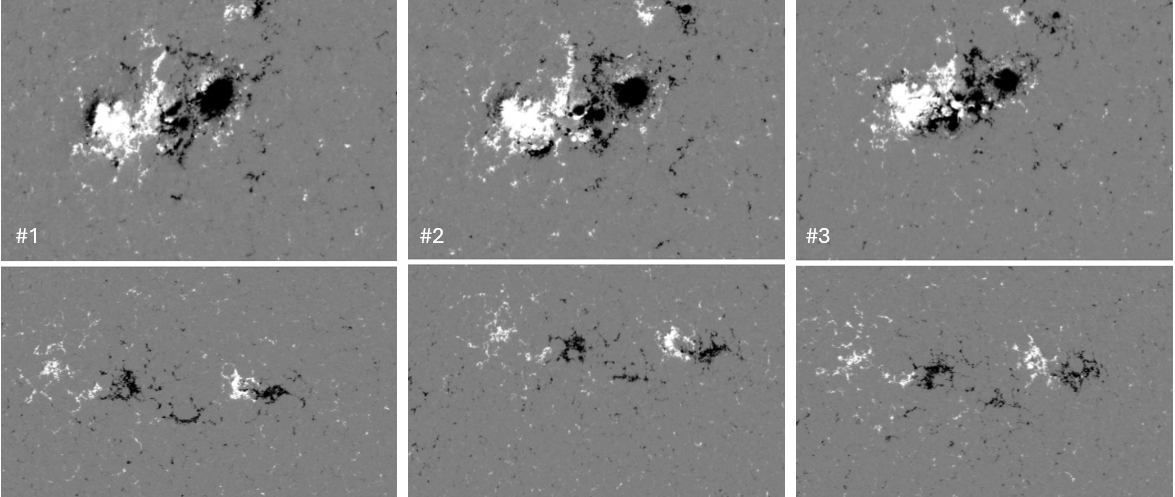
Compare region A (top) and region b (bottom) and the changes that occur over 3 images.

Compare the changes in 2 regions.

Which region do you think is most likely to flare?

Asemmisa {{asɛmmisaAhyɛnsode}}
14.

Threatening Filaments

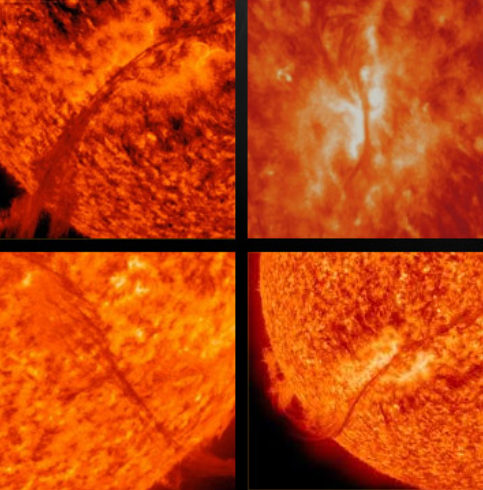
Spots on the surface of the Sun are not the only sign of potential solar storms. In fact, storms can erupt from relatively small, simple sunspot regions, so it's important to observe what's happening above the surface, in the chromosphere and corona. Signs like bands of plasma, called filaments, which can be seen stretching across large regions in the images on the right, can indicate the strong possibility of a storm.

Filaments can indicate the strong possibility of a storm.

Asemmisa {{asɛmmisaAhyɛnsode}}
15.

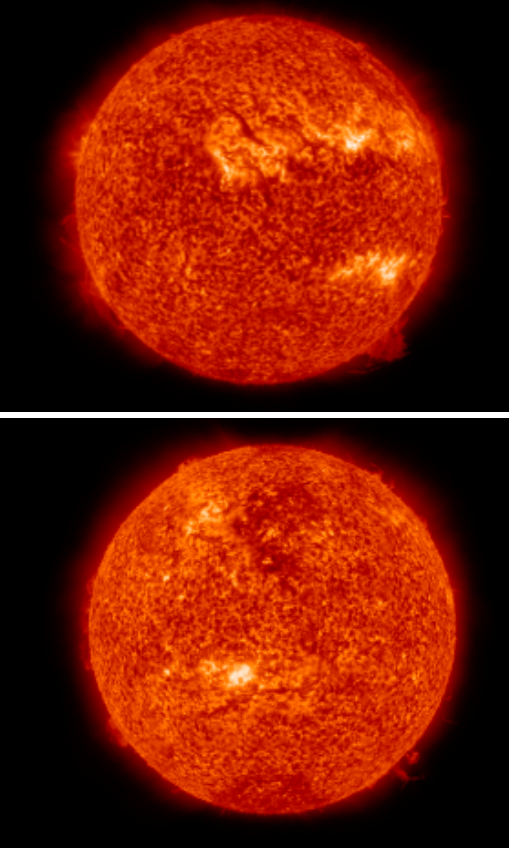
Compare the 2 images of the Sun.

Which image do you think is most likely to flare?

Asemmisa {{asɛmmisaAhyɛnsode}}
16.

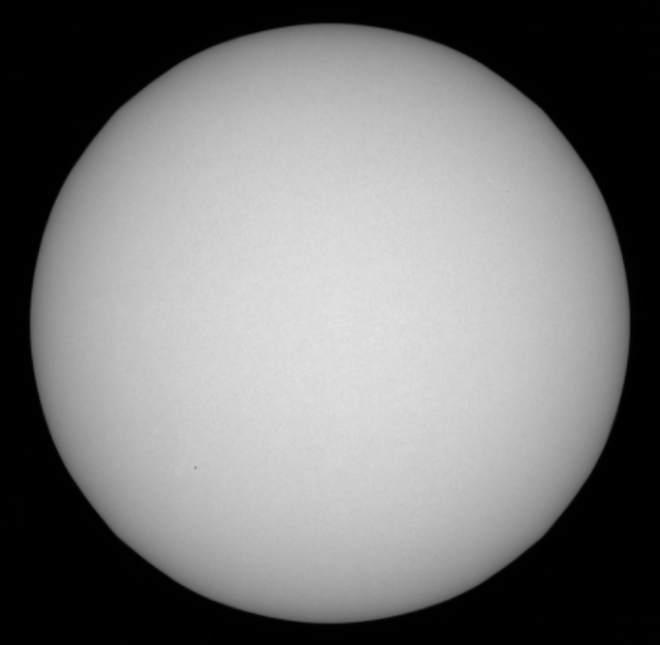
This is an image of the Sun on December 25, 2019.

How many spots do you see?

How many groups do you see?

Asemmisa {{asɛmmisaAhyɛnsode}}
17.

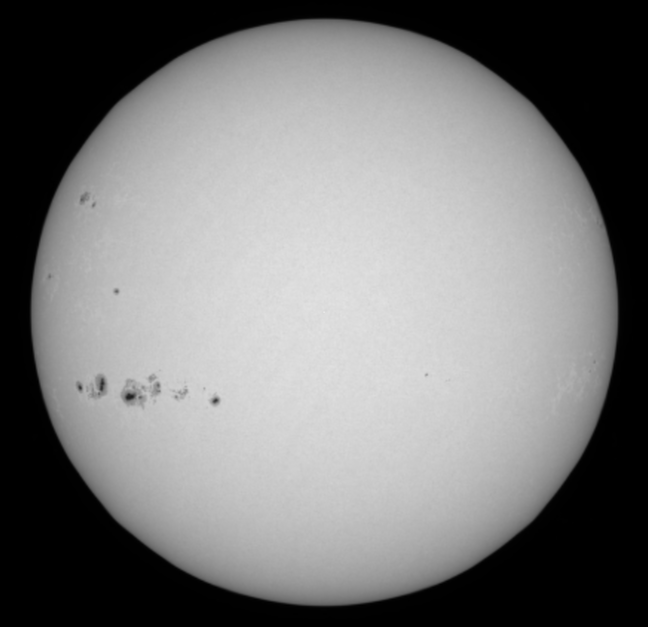
This image of the Sun is from December 2, 2025. Notice the change in the amount of sunspots.

We can conclude that solar activity has .