Twa kɔ nsɛm atitiriw so
Log in
Sign up for FREE
arrow_back
Laabri

1.03 Analyzing CO2 Lab MOD

star
star
star
star
star
Last updated about 1 month ago
14 Nsɛmmisa
Hyɛ no nsow a efi ɔkyerɛwfo no hɔ:
Ɛhia
1
HS-ESS2-6
Ɛhia
0
Ɛhia
1
HS-SEP-2.c
Ɛhia
1
HS-ESS2-6
Ɛhia
1
HS-ESS2-6

Learning Objectives

  1. Analyze graphs of atmospheric carbon dioxide concentration to identify trends.

  2. Make a data-based claim about the likely causes using evidence.

If you need help with this assignment, please watch the class recording (which uses non-MOD version)

Learning Objectives

  1. Analyze graphs of atmospheric carbon dioxide concentration to identify trends.

  2. Make a data-based claim about the likely causes using evidence.

If you need help with this assignment, please watch the class recording (which uses non-MOD version)

Asemmisa {{asɛmmisaAhyɛnsode}}
1.

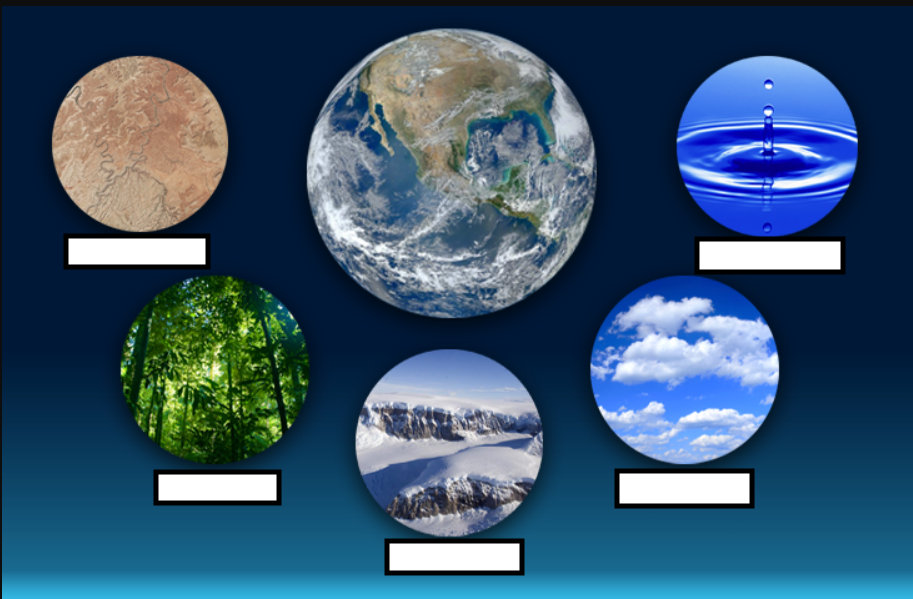
Our Earth is an interconnected system. When one part changes, it can trigger changes in others.

We can group these parts into:

  • Atmosphere: The layer of gases surrounding Earth that regulates temperature, protects life from harmful radiation, and drives weather and climate.

  • Hydrosphere: All liquid water on Earth — oceans, rivers, lakes, groundwater, and precipitation — which circulates through the other spheres and supports life.

  • Biosphere: All living organisms and the ecosystems they form, interacting with other spheres to cycle energy and matter.

  • Cryosphere: The frozen parts of Earth — glaciers, ice caps, sea ice, and permafrost — which influence sea level, albedo, and climate patterns.

  • Geosphere: The solid Earth — rocks, minerals, mountains, and the planet’s interior — that shapes landscapes and provides the foundation for soils and landforms.

Drag each label to the image that best represents that sphere.
Mmuae Afoforo a Wobɛpaw:
hydrosphere
atmosphere
geosphere
cryosphere
biosphere

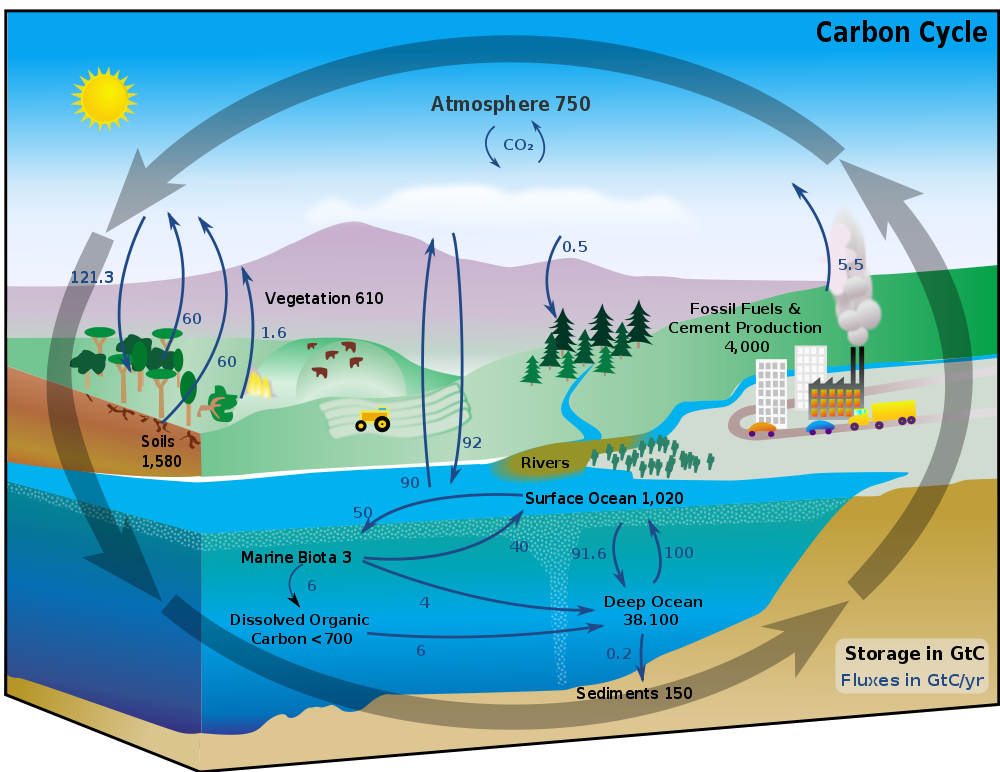
Carbon (atomic symbol C) is the foundational element for all life on Earth. Its unique ability to form four stable, versatile bonds with other atoms allows it to create diverse structures necessary for organic life, energy storage, and environmental regulation through the carbon cycle.

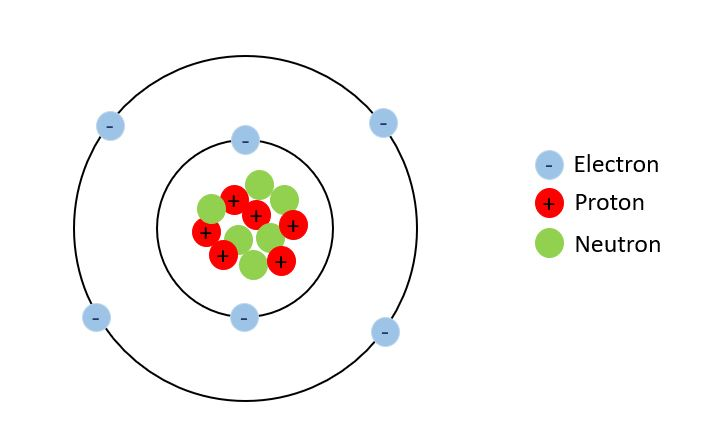
Atoms are too small to see, so we can use a Bohr model to represent the structure of carbon.

1
Asemmisa {{asɛmmisaAhyɛnsode}}
2.

Carbon atoms have electrons.

Carbon is able to form strong bonds with other atoms with its

HS-ESS2-6
Asemmisa {{asɛmmisaAhyɛnsode}}
4.

Thinking Question: How do scientists measure the amount of carbon dioxide in the atmosphere?

Question 5
01:47
keyboard_arrow_down
Ɛhia
1
Asemmisa {{asɛmmisaAhyɛnsode}}
5.

How have scientists measured atmospheric carbon dioxide since 1955?

HS-ESS2-6
Question 6
01:59
keyboard_arrow_down
Ɛhia
1
Asemmisa {{asɛmmisaAhyɛnsode}}
6.

How have scientists measured historical atmospheric carbon dioxide?

HS-ESS2-6
Asemmisa {{asɛmmisaAhyɛnsode}}
7.

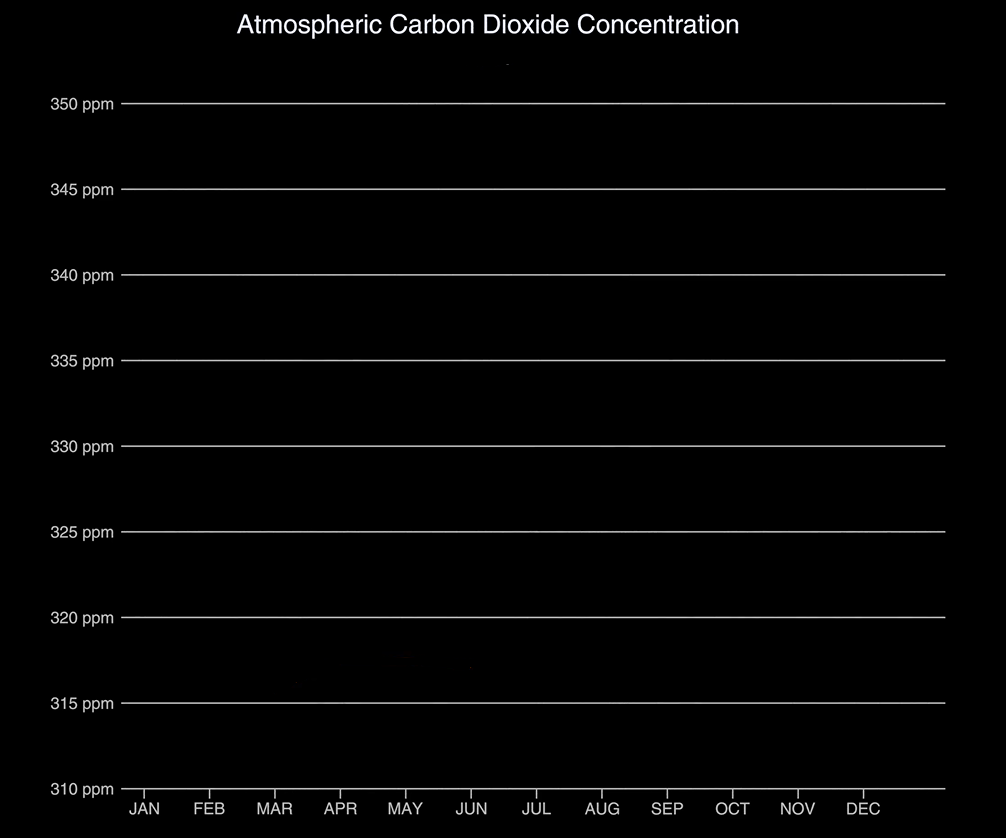
We are about to examine an animated graph.

First, let's make sure we know what is being represented on the axes and the graph itself.

Mmuae Afoforo a Wobɛpaw:
Amount of CO2 (PPM/Parts Per Million)
Time of Year (Month)
Change in CO2 Over Time
Questions 8 & 9
00:22
keyboard_arrow_down
2
Asemmisa {{asɛmmisaAhyɛnsode}}
8.

Estimate the level of CO2 to the closest labeled white line.

The amount of atmospheric CO2 started around parts per million (ppm) in 2025.

HS-ESS2-6
HS-SEP-2.d
Ɛhia
2
Asemmisa {{asɛmmisaAhyɛnsode}}
9.

We can conclude that the amount of atmospheric CO2 has

Asemmisa {{asɛmmisaAhyɛnsode}}
14.

Which statement best restates the learning objectives of this assignment?

Asemmisa {{asɛmmisaAhyɛnsode}}
10.

How has the graph changed?

Instead of representing CO2 concentration by .

Asemmisa {{asɛmmisaAhyɛnsode}}
11.

What does the yellow part of the line represent?

Asemmisa {{asɛmmisaAhyɛnsode}}
12.

What trends in CO2 do you notice when examining levels from 800,000 BCE to present? Use evidence from the graph.