Analyze patterns in climate data by interpreting graphs to identify seasonal cycles, long-term trends, and differences between Arctic and Antarctic sea ice extent.
Explain feedback mechanisms in Earth's climate system by connecting the albedo effect to ice loss and predicting how melting accelerates warming.
Evaluate the consequences of sea ice loss by distinguishing between the impacts of melting sea ice versus land ice and reasoning about implications for ecosystems and human communities.
Read and understand sea ice graphs by finding the highest and lowest points, spotting patterns that repeat every year, explaining why Arctic and Antarctic ice melt at different times, and describing what changes over many years.
Explain how melting ice creates more melting by describing how ice reflects sunlight but water absorbs it, showing how this causes more warming and more ice to melt, and connecting this cycle to why Arctic ice is disappearing so fast.
Connect what you learned to the real world by explaining why melting glaciers on land are more dangerous than floating sea ice melting, making predictions about what the Arctic might look like in the future, and thinking about what could slow down or stop ice loss.
Analyze patterns in climate data by interpreting graphs to identify seasonal cycles, long-term trends, and differences between Arctic and Antarctic sea ice extent.
Explain feedback mechanisms in Earth's climate system by connecting the albedo effect to ice loss and predicting how melting accelerates warming.
Evaluate the consequences of sea ice loss by distinguishing between the impacts of melting sea ice versus land ice and reasoning about implications for ecosystems and human communities.
Read and understand sea ice graphs by finding the highest and lowest points, spotting patterns that repeat every year, explaining why Arctic and Antarctic ice melt at different times, and describing what changes over many years.
Explain how melting ice creates more melting by describing how ice reflects sunlight but water absorbs it, showing how this causes more warming and more ice to melt, and connecting this cycle to why Arctic ice is disappearing so fast.
Connect what you learned to the real world by explaining why melting glaciers on land are more dangerous than floating sea ice melting, making predictions about what the Arctic might look like in the future, and thinking about what could slow down or stop ice loss.
Make a hypothesis about the extent of sea ice in the Arctic throughout the year:
What time of the year will have the greatest amount of sea ice?
What time of the year will have the least amount of sea ice?
Make a hypothesis about the extent of sea ice in Antarctica throughout the year:
What time of the year will have the greatest amount of sea ice?
What time of the year will have the least amount of sea ice?
Polar oceans don't cool down or warm up as fast as the air above it. This is called thermal lag.
As a result, sea ice minimums/maximums occur at the of the season.
Observe 3 years of Arctic sea ice extent:
This data table tracks the changes over the 3 year period:Month | Arctic Sea Ice Extent (million sq km) |
|---|---|
Jan 2016 | ~11.5 |
Feb 2016 | ~12.5 |
Mar 2016 | ~14.5 |
Apr 2016 | ~12.5 |
May 2016 | ~9 |
Jun 2016 | ~7 |
Jul 2016 | ~5.5 |
Aug 2016 | ~5 |
Sep 2016 | ~4.5 |
Oct 2016 | ~6.5 |
Nov 2016 | ~9 |
Dec 2016 | ~11 |
Jan 2017 | ~11.5 |
Feb 2017 | ~12.5 |
Mar 2017 | ~14.5 |
Apr 2017 | ~12.5 |
May 2017 | ~9 |
Jun 2017 | ~7 |
Jul 2017 | ~5.5 |
Aug 2017 | ~5 |
Sep 2017 | ~4.5 |
Oct 2017 | ~6.5 |
Nov 2017 | ~9 |
Dec 2017 | ~11 |
Jan 2018 | ~11.5 |
Feb 2018 | ~12.5 |
Mar 2018 | ~14.5 |
Apr 2018 | ~12.5 |
May 2018 | ~9 |
Jun 2018 | ~7 |
Jul 2018 | ~5.5 |
Aug 2018 | ~5 |
Sep 2018 | ~4.5 |
Oct 2018 | ~6.5 |
Nov 2018 | ~9 |
Dec 2018 | ~11 |
Which month typically has the greatest amount of sea ice?
Which month typically has the least amount of sea ice?
Observe 3 years of Antarctic sea ice extent:
This data tables tracks the changes over the 3 year period:Month | Antarctic Sea Ice Extent (million sq km) |
Jan 2016 | ~14 |
Feb 2016 | ~2.5 |
Mar 2016 | ~8 |
Apr 2016 | ~11 |
May 2016 | ~14 |
Jun 2016 | ~16.5 |
Jul 2016 | ~18 |
Aug 2016 | ~18.4 |
Sep 2016 | ~18.5 |
Oct 2016 | ~16 |
Nov 2016 | ~12 |
Dec 2016 | ~9 |
Jan 2017 | ~14 |
Feb 2017 | ~2.5 |
Mar 2017 | ~8 |
Apr 2017 | ~11 |
May 2017 | ~14 |
Jun 2017 | ~16.5 |
Jul 2017 | ~18 |
Aug 2017 | ~18.4 |
Sep 2017 | ~18.5 |
Oct 2017 | ~16 |
Nov 2017 | ~12 |
Dec 2017 | ~9 |
Jan 2018 | ~14 |
Feb 2018 | ~2.5 |
Mar 2018 | ~8 |
Apr 2018 | ~11 |
May 2018 | ~14 |
Jun 2018 | ~16.5 |
Jul 2018 | ~18 |
Aug 2018 | ~18.4 |
Sep 2018 | ~18.5 |
Oct 2018 | ~16 |
Nov 2018 | ~12 |
Dec 2018 | ~9 |
Which month typically has the greatest amount of sea ice?
Which month typically has the least amount of sea ice?
The sea ice extent data from the Arctic and Antarctica over the course of 3 years was graphed:
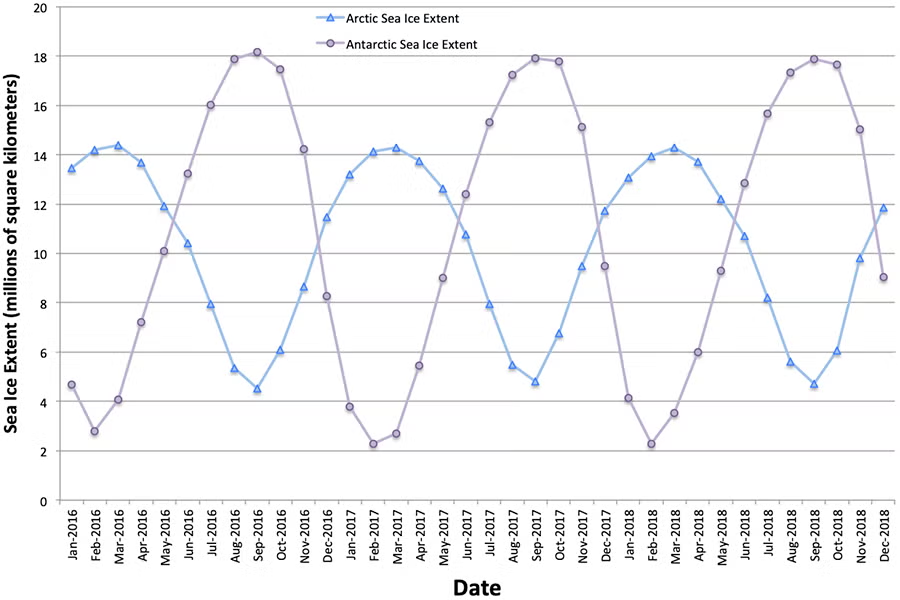
What can you conclude based on your observations and the graph?
When Arctic sea ice reaches its maximum, Antarctic sea ice is at its .
When Antarctic sea ice reaches its maximum, Arctic sea ice is at its .
This pattern reflects the fact that the Northern and Southern Hemispheres experience throughout the year.
Was your prediction about the timing of maximum and minimum ice correct?
Using the sea ice extent data from the Arctic and Antarctica over the course of 3 years again:

Look at the overall size of the two patterns.
Which one has more ice at its maximum?
Which one has more ice at its minimum?
Which one shows more dramatic seasonal variation (bigger difference between max and min)?
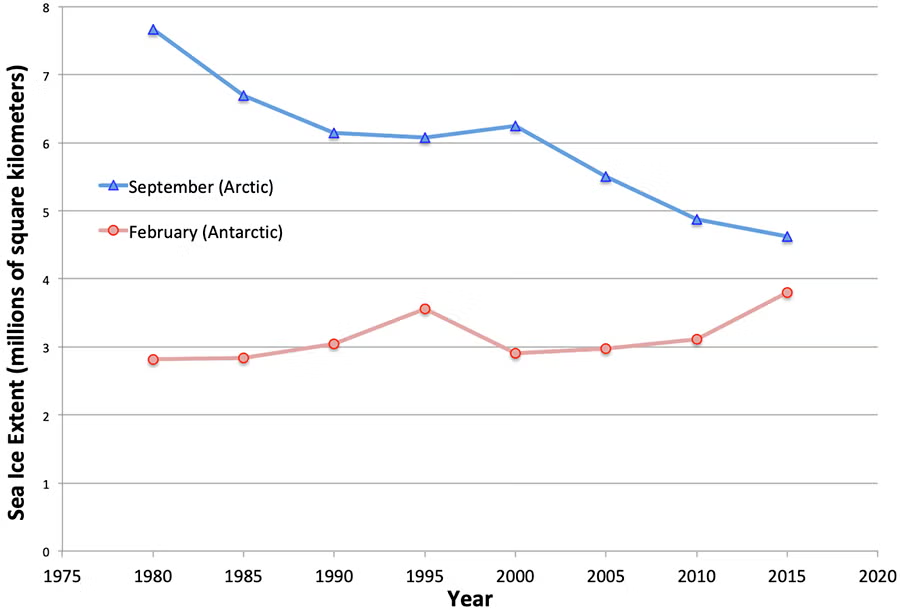
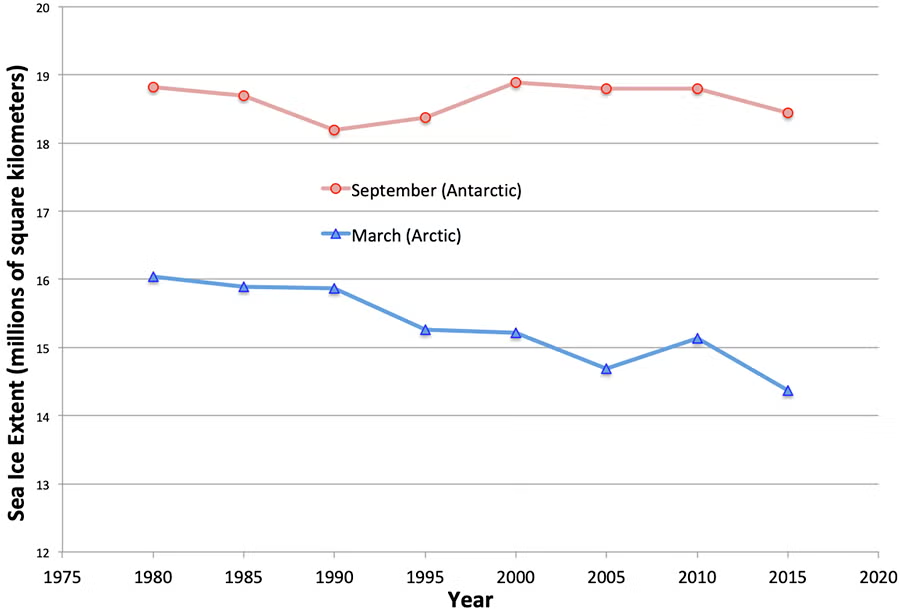
This graph represents the yearly maximum sea ice extent in the Antarctic (red) and Arctic (blue) from 1980 to 2015:

"Relatively stable" means a change of 1 million square kilometers or less (staying between 2 gray lines.)

Describe the Antarctic September maximum trend from 1980 to 2015:
Describe the Arctic March maximum trend from 1980 to 2015:
Which hemisphere is experiencing more dramatic ice loss during maximum ice extent?
This graph represents the yearly minimum sea ice extent in the Antarctic (red) and Arctic (blue) from 1980 to 2015:
"Relatively stable" means a change of 1 million square kilometers or less (staying between 2 gray lines.)
Describe the Arctic September maximum trend from 1980 to 2015:
Describe the Antarctic March maximum trend from 1980 to 2015:
Which hemisphere is experiencing more dramatic ice loss at minimum ice extent?
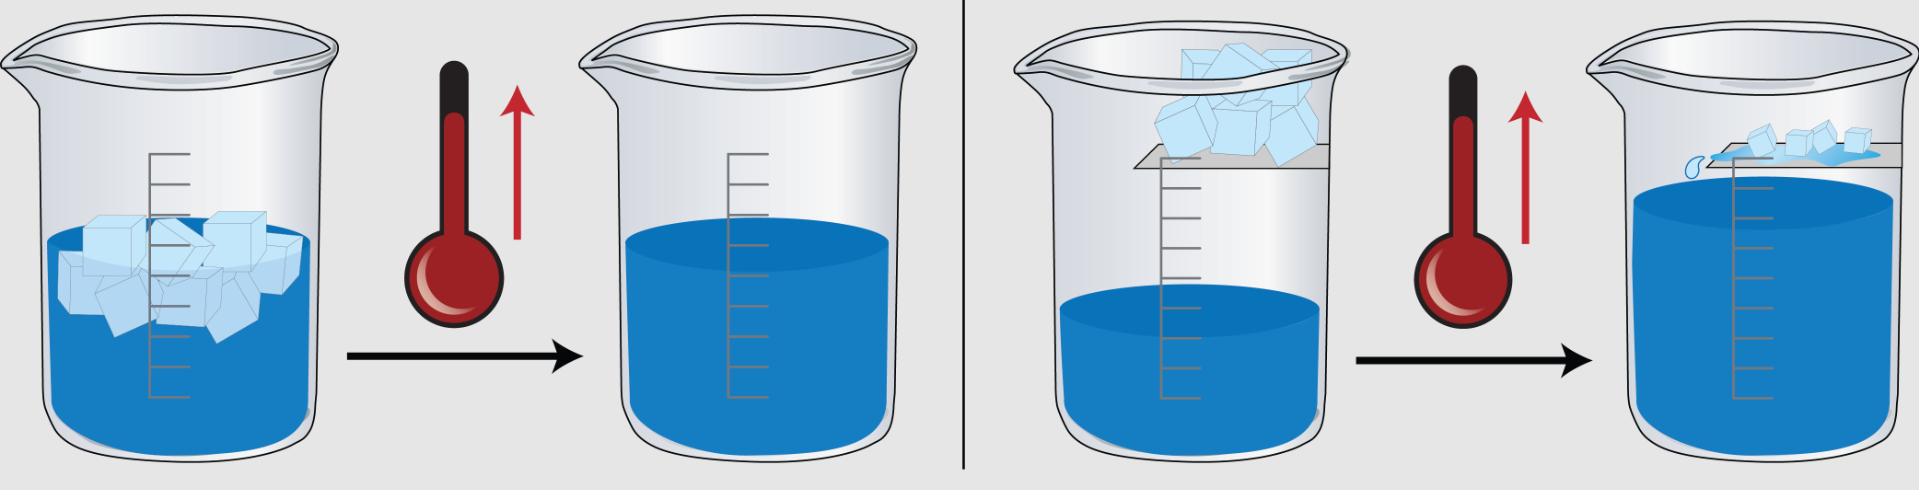
Consider the models below. Which represents each scenario?

melting sea ice
melting land ice
Which student response best explains the key difference between sea and land ice melting?
Think about it: Consider the interaction of sunlight, ice, and ocean water in these images. How does this create a feedback loop?

While Arctic sea ice decline doesn't directly cause sea level rise, the same warming that melts Arctic sea ice also melts land ice.
Which of the following would contribute to sea level rise if they began to melt?
Below is the NOAA Sea Level Rise Viewer.
Use the vertical slider to simulate water level rise.
Blue areas represent areas affected by sea level rise. Darker blue = greater depth
Green areas represent low-lying areas not connected to the ocean but may also flood.
According to NOAA models, by 2050 the following could occur:
East Coast: 1.3–1.5 feet
Gulf Coast: 1.8–2.1 feet
West Coast: 0.7–1 foot
Use the Sea Level Rise Viewer to adjust the sea level rise and observe each coast.
Which of the following regions is projected to experience the LEAST sea level rise by 2050?
Zoom in to where you live. Will your home be affected by sea level rise?
Reflect on your understanding of the learning objectives:
Analyze patterns in climate data by interpreting graphs to identify seasonal cycles, long-term trends, and differences between Arctic and Antarctic sea ice extent. | |
|---|---|
Explain feedback mechanisms in Earth's climate system by connecting the albedo effect to ice loss and predicting how melting accelerates warming. | |
Evaluate the consequences of sea ice loss by distinguishing between the impacts of melting sea ice versus land ice and reasoning about implications for ecosystems and human communities. |
Reflect on your mastery of the success criteria:
Read and understand sea ice graphs by finding the highest and lowest points, spotting patterns that repeat every year, explaining why Arctic and Antarctic ice melt at different times, and describing what changes over many years. | |
|---|---|
Explain how melting ice creates more melting by describing how ice reflects sunlight but water absorbs it, showing how this causes more warming and more ice to melt, and connecting this cycle to why Arctic ice is disappearing so fast. | |
Connect what you learned to the real world by explaining why melting glaciers on land are more dangerous than floating sea ice melting, making predictions about what the Arctic might look like in the future, and thinking about what could slow down or stop ice loss. |
Predict: Which will melt faster?
Predict: Which will cause sea level to rise?
Which melted faster?
Which caused sea level to rise?
Which of the following is a major contributor to current climate change?
The Arctic Circle is warming
What happens when Arctic sea ice melts, according to the Albedo feedback described?
How does melting permafrost contribute to climate change?
How has the Beaufort Gyre changed because of added freshwater from melting ice?
How is Antarctica different from the Arctic circle?
Despite an increase in sea ice around , the Earth is still ice overall.
If humans stopped all greenhouse gas emissions immediately, Arctic ice would: