Describe how shifts in climate creates cascading effects on ecosystems, water availability, and agriculture in Washington State.
Analyze temperature data to identify how Washington's climate is changing over time.
Explain the cause-and-effect relationships between climate change and its consequences in Washington.
Describe how shifts in climate creates cascading effects on ecosystems, water availability, and agriculture in Washington State.
Analyze temperature data to identify how Washington's climate is changing over time.
Explain the cause-and-effect relationships between climate change and its consequences in Washington.
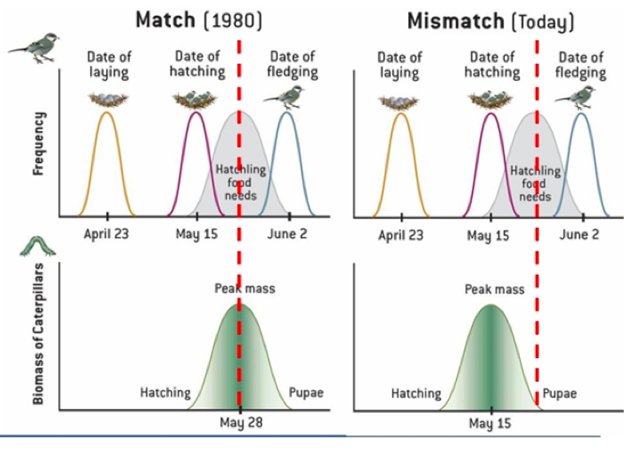
According to the graphs, caterpillars now reach their peak biomass on May 15 instead of May 28, causing them to no longer align with bird hatchling food needs.
Which of the following best explains what could have caused this shift in caterpillar timing?
Due to the change in timing, what is the most likely consequence for the bird population?
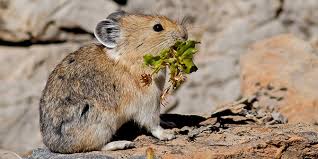
The American pika is a small, mountain-dwelling rodent that is extremely sensitive to temperature changes.
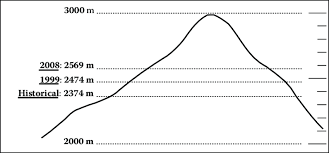
Scientists have been monitoring the elevations at which pikas are found across the western United States:
What trend is shown in the pika elevation data?
If pikas continue moving upward at the same rate shown in the data (approximately 10.6 m per year), what would eventually happen to the pika population?

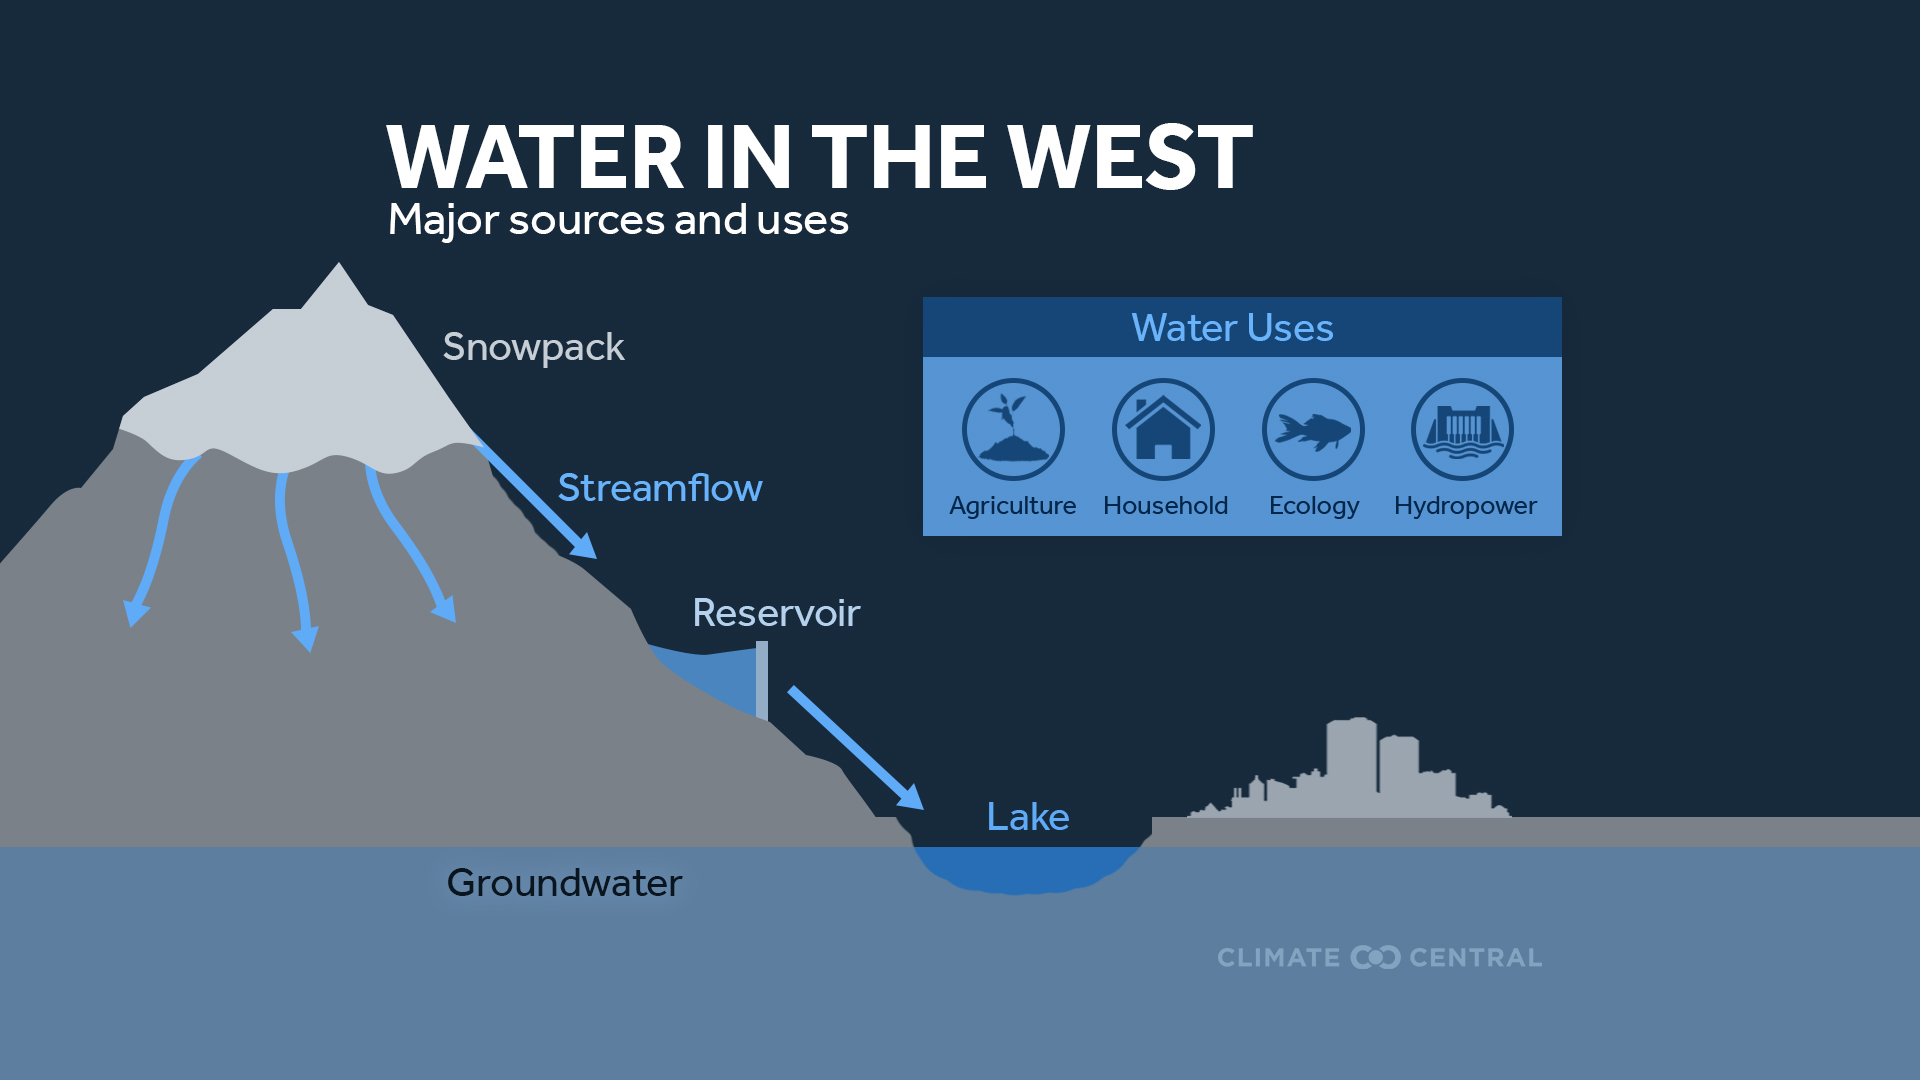
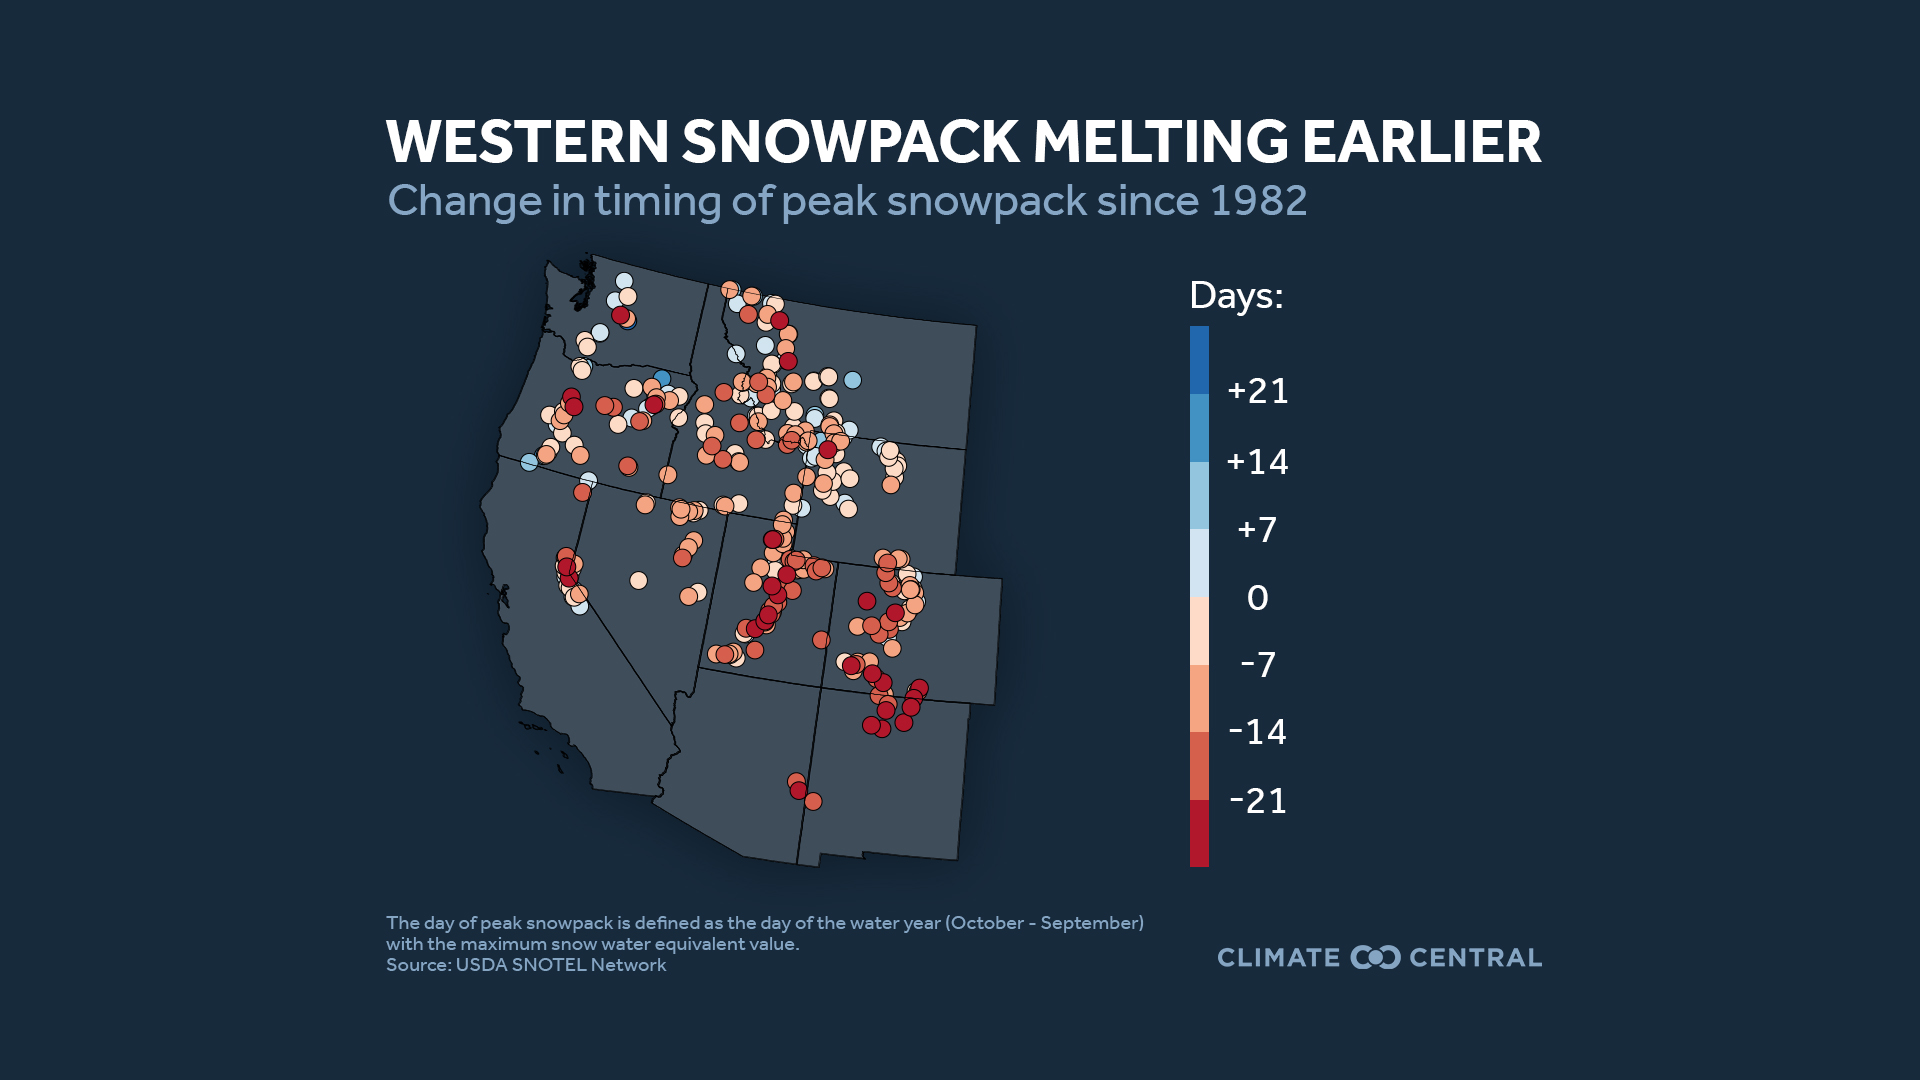
If peak snowpack is now occurring 21 days earlier (as shown by reddish circles), how would this affect the water available for agriculture during summer?
Based on the snowpack map showing earlier peak snowpack, what might be a consequence for aquatic ecosystems?
Use the website embeded above or open the Impact Map in a new tab to complete the data table.
Historical 1986-2005 | Next 20 Years 2020-2039 | Mid-Century 2040-2059 | End of Century 2080-2099 | Overall Change | |
|---|---|---|---|---|---|
Average Jun/Jul/Aug Temps | |||||
Average Dec/Jan/Feb Temps | |||||
Average Annual Temps | |||||
#Days < 32°F | |||||
#Days > 95°F |
Analysis
Overall, the data shows that Washington state will experience temperatures over time.
The data also shows that days below 32°F are while days above 95°F are , which reveals that seasonal extremes are becoming .
Select a different state of your choice, and use the Climate Impact Map to research its historical and projected temperature data for the same time periods shown in the Washington data table (1986-2005, 2020-2039, 2040-2059, 2080-2099).
Choose TWO of the following:
Average Jun/Jul/Aug Temps
Average Dec/Jan Feb Temps
Average Annual Temps
#Days < 32°F
#Days > 95°F
Compare those TWO specific data points between your selected state and Washington with supporting data.
Reflect on your understanding of the learning objectives:
Describe how shifts in climate creates cascading effects on ecosystems, water availability, and agriculture in Washington State. | |
|---|---|
Analyze temperature data to identify how Washington's climate is changing over time. |
Reflect on your mastery of the success criteria:
Explain the cause-and-effect relationships between climate change and its consequences in Washington. |
What effect does reduced snowpack in the mountains have on rivers?
What is contributing to the restrictions placed on hunting certain species like the black brant?
How is climate change affecting recovery after a wildfire?
What could be used to reduce wildfires?
What are some of your favorite outdoor activities? How could climate change affect them?
What has caused the decrease in the salmon population?
How has shrinking glaciers affected the streams salmon live in?
Salmon die if the water temperature rises above degrees
By 2080, of streams are expected to average that temperature
How will sea level rise affect salmon?
What is the Swinomish tribe's traditional knowledge based on?
The Swinomish tribe have become experts in climate change at the level
Who do the speakers in the video believe need to make change happen?