Below is a screen shot of the Very Simple Climate Model. Let's make sure we know what each part represents before we use it.
What do the three different colored data points represent?
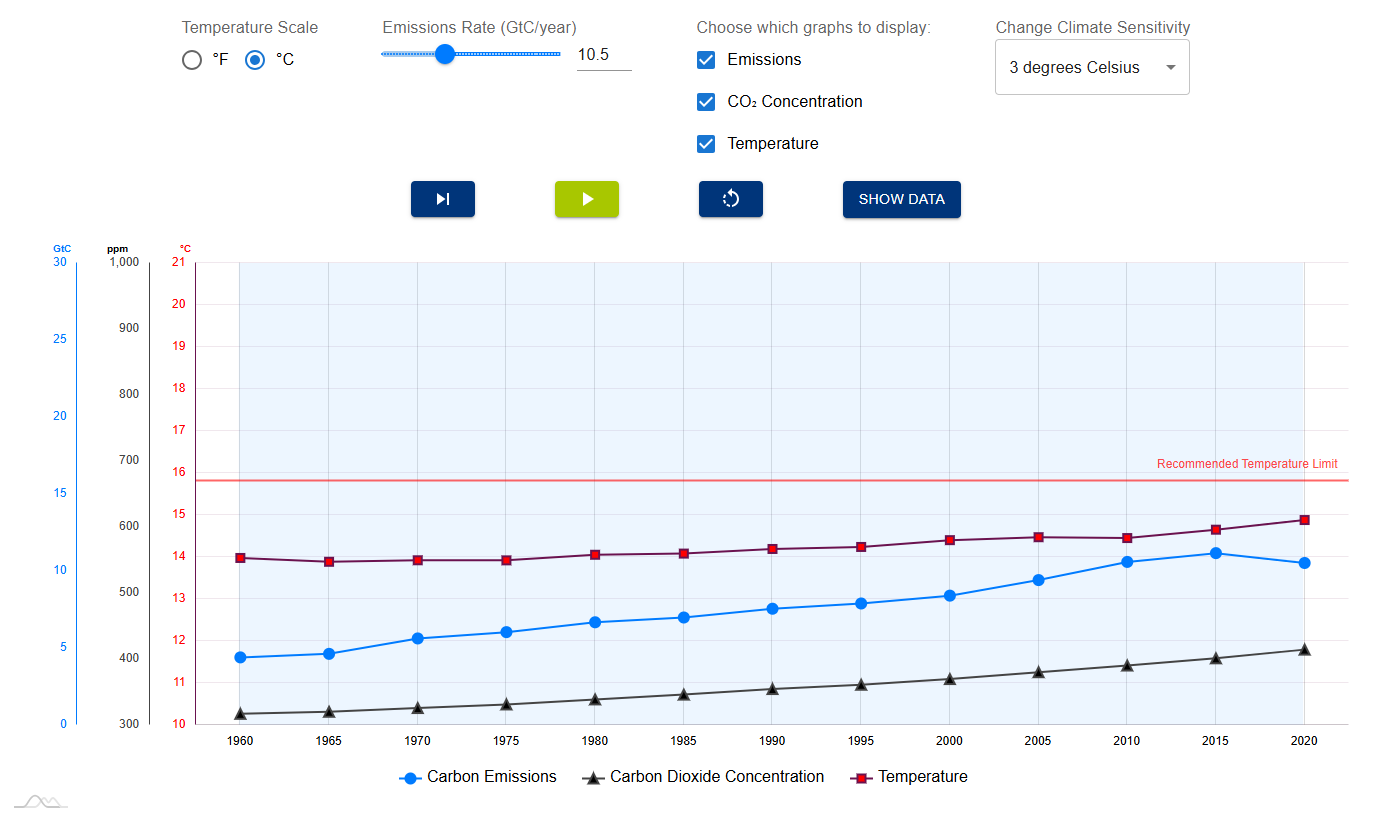
Blue circles:
Black triangles:
Red squares:
Use a climate model to understand how carbon emissions affect atmospheric CO₂ and global temperature
Predict future climate outcomes under different emission scenarios.
Record predicted values for 2100 under multiple scenarios and calculate how much temperature exceeds the limit
Determine the emission level needed to keep global temperature below the recommended limit by 2100
Use a climate model to understand how carbon emissions affect atmospheric CO₂ and global temperature
Predict future climate outcomes under different emission scenarios.
Record predicted values for 2100 under multiple scenarios and calculate how much temperature exceeds the limit
Determine the emission level needed to keep global temperature below the recommended limit by 2100
A climate model is a computer program that uses math to describe how Earth's climate system works. Scientists use models to predict future climate changes.
Think About It: Why is a climate model useful to scientists? What might be some challenges or limitations of the model?
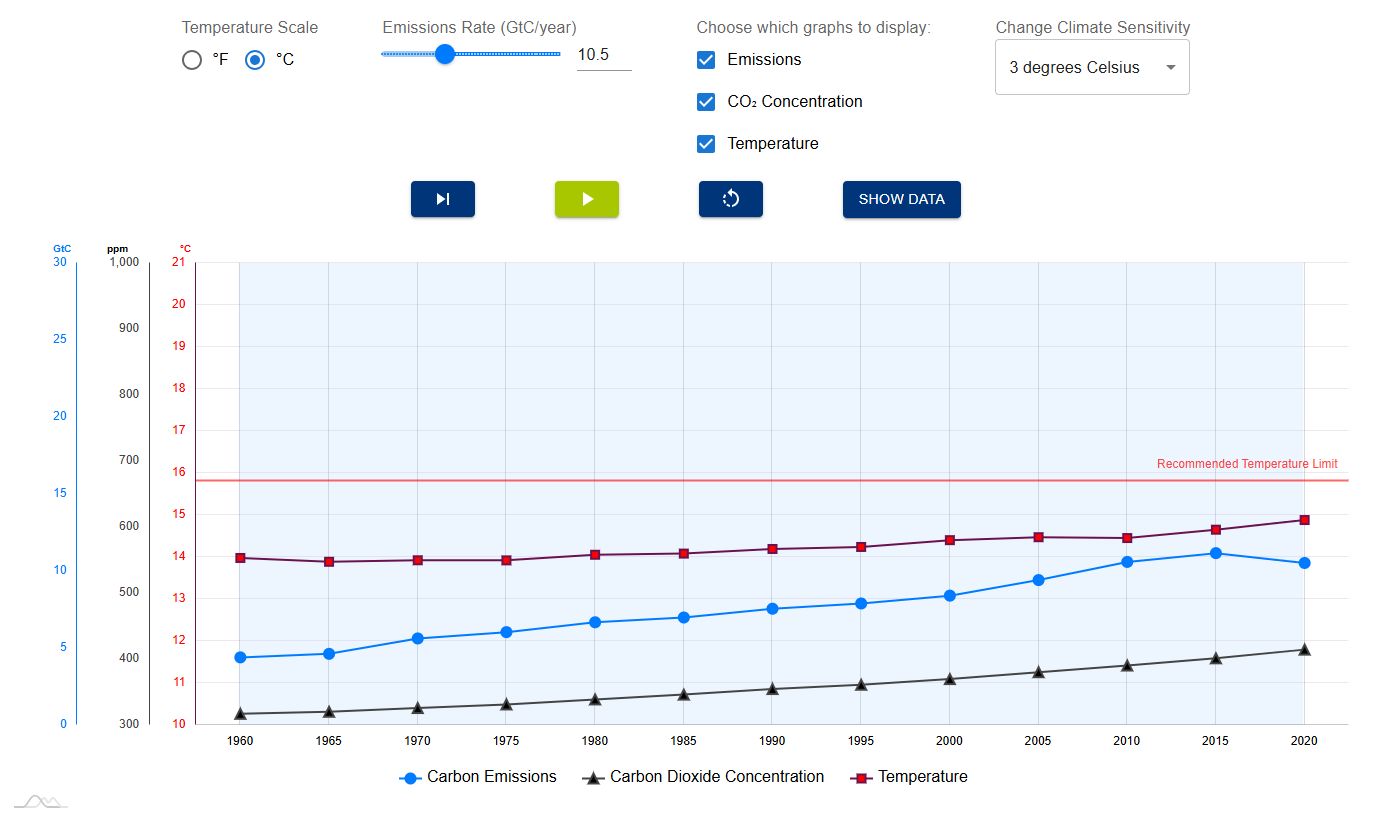
Below is a screen shot of the Very Simple Climate Model. Let's make sure we know what each part represents before we use it.
What do the three different colored data points represent?
Blue circles:
Black triangles:
Red squares:
What pattern do you notice about each line over time? While there may be some variations, what is the overall trend from 1960 to 2020?
Emissions rate:
Carbon dioxide concentration:
Temperature:
The recommended temperature limit line (15.81 °C) reflects 2 °C of warming above pre-industrial times, after which scientists predict life on Earth will be significantly impacted and it will be difficult to adapt.
Which part of the graph represents the recommended temperature line?
Scenario 1: No Change in Emissions
What if we continue to produce the same amount of carbon dioxide into the atmosphere as in the year 2020 (10.5 GtC/yr)?
Open the Very Simple Climate Model.
By moving your cursor over points on the graph, you can see the values of each variable.
Click the play button to see what will happen to Earth's temperature through the 21st century.
Record the predicted values for 2100. The units are provided for you.
Temperature:
Carbon Emissions:
CO2 Concentration:
How far over did the final temperature exceed the recommended temperature limit (15.81° C)?
What if the rate that we add carbon dioxide to the atmosphere continues to increase by 0.5 GtC/year every 10 years?
Reset the model.
Increase the Emissions Rate by 0.5 to 11 GtC/year.
Click the Step Forward button twice.
Continue to increase the Emissions Rate by 0.5 GtC/year every 10 years and click Step Forward twice. Repeat these steps until you have reached 2100, when your Emissions Rate should have reached 14.5 GtC/year.
Put your cursor over the year 2100 and record the data. The units are provided for you.
Temperature:
Carbon Emissions:
CO2 Concentration:
How far over did the final temperature exceed the recommended temperature limit (15.81° C)?
What if the rate that we add carbon dioxide to the atmosphere decreases by 0.5 GtC/year every 10 years?
Reset the model.
Decrease the Emissions Rate by 0.5 to 10 GtC/year.
Click the Step Forward button twice.
Continue to decrease the Emissions Rate by 0.5 GtC/year every 10 years and click Step Forward twice. Repeat these steps until you have reached 2100, when your Emissions Rate should have reached 6.5 GtC/year.
Put your cursor over the year 2100 and record the data. The units are provided for you.
Temperature:
Carbon Emissions:
CO2 Concentration:
How far over did the final temperature exceed the recommended temperature limit (15.81° C)?
Even when emissions began to decrease in Scenario 3, what happened to the CO2 concentration?
What happened to the temperature?
Which scenario stayed below the Recommended Temperature Limit?
What is the minimum level of CO2 emissions that would keep the temperature below the Recommended Temperature Limit (15.81° C)?
Reset the similation.
Adjust the Emissions Rate and click play.
Play the simulation until you find the highest Emissions Rate where the temperature remains UNDER the Recommended Temperature Limit by 2100. You may have to run the model several times.
What would global carbon emissions need to become in the next 5 years in order to keep the temperature from going over the recommended limit in 2100?
Reflect on the Very Simple Climate Model's limitations.
What the model DOES show us:
✓ Relationship between CO₂ emissions and atmospheric concentration
✓ Relationship between CO₂ concentration and global temperature
✓ Why even reducing emissions doesn't immediately lower temperature
✓ Long-term climate trends
What the model DOES NOT show us:
✗ Local climate changes (only global averages)
✗ Effects of clouds, sea ice, forests, and other factors
✗ Other greenhouse gases besides CO₂
✗ Year-to-year weather variations
✗ Different impacts on different regions
Why might scientists use a "very simple" model even though Earth's climate is complex?
Reflect on your understanding of the learning objectives:
Use a climate model to understand how carbon emissions affect atmospheric CO₂ and global temperature | |
|---|---|
Predict future climate outcomes under different emission scenarios. |
Reflect on your mastery of the success criteria:
Record predicted values for 2100 under multiple scenarios and calculate how much temperature exceeds the limit | |
|---|---|
Determine the emission level needed to keep global temperature below the recommended limit by 2100 |
If we stopped burning carbon tomorrow, what would happen to global temperatures?
Where has most of the extra warming from climate change gone over the last 50 years?
Which greenhouse gas stay in the atmosphere longer due to its chemical stability?
If we cut all carbon emissions today, we would solve climate change.
According to the video, what is essential for future generations regarding climate change?