Unit 6 Practice/Homework
star
star
star
star
star
Last updated 20 days ago
72 Nsɛmmisa
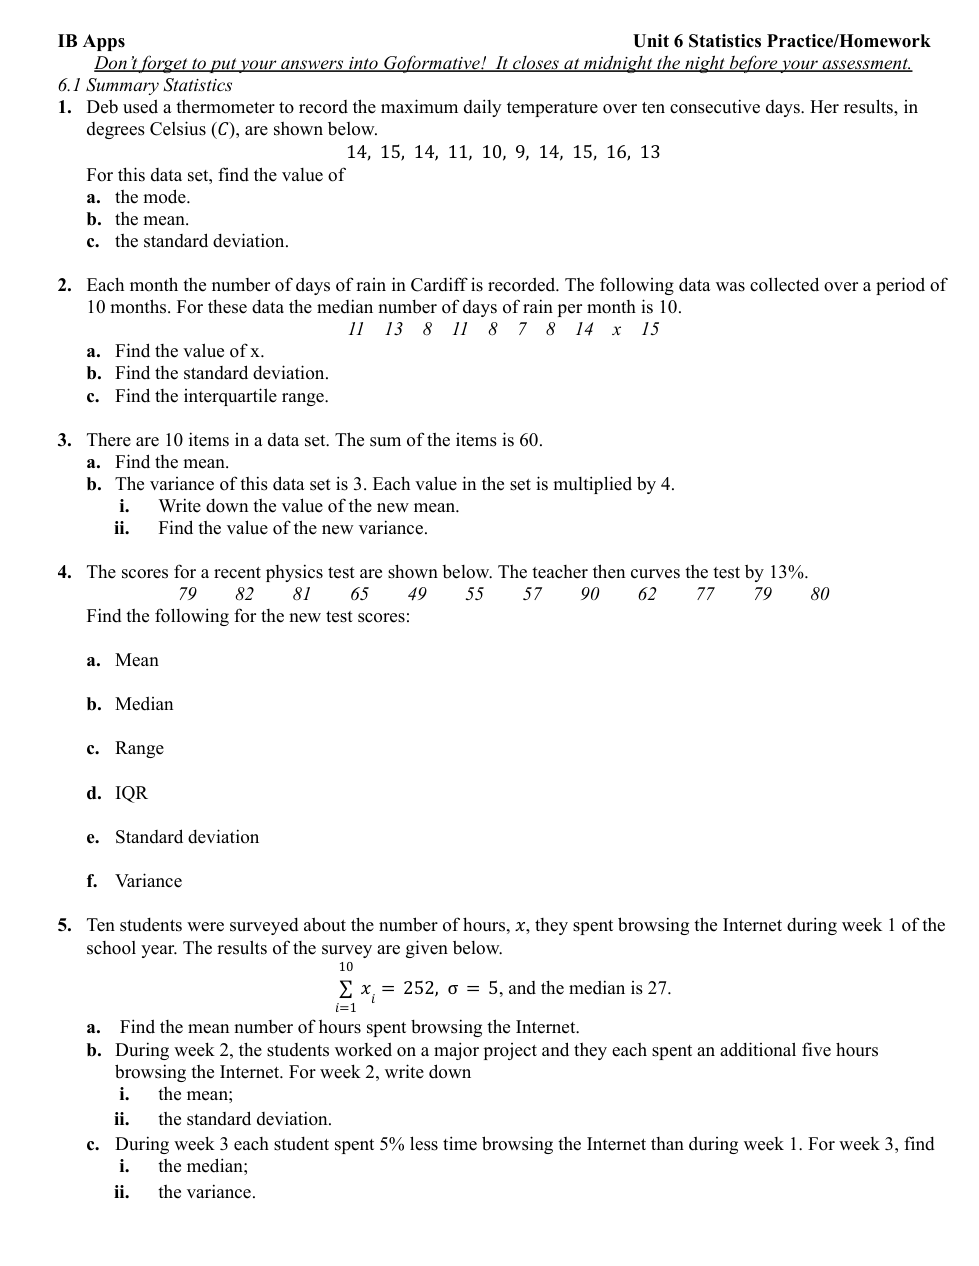
The mode.
The mean.
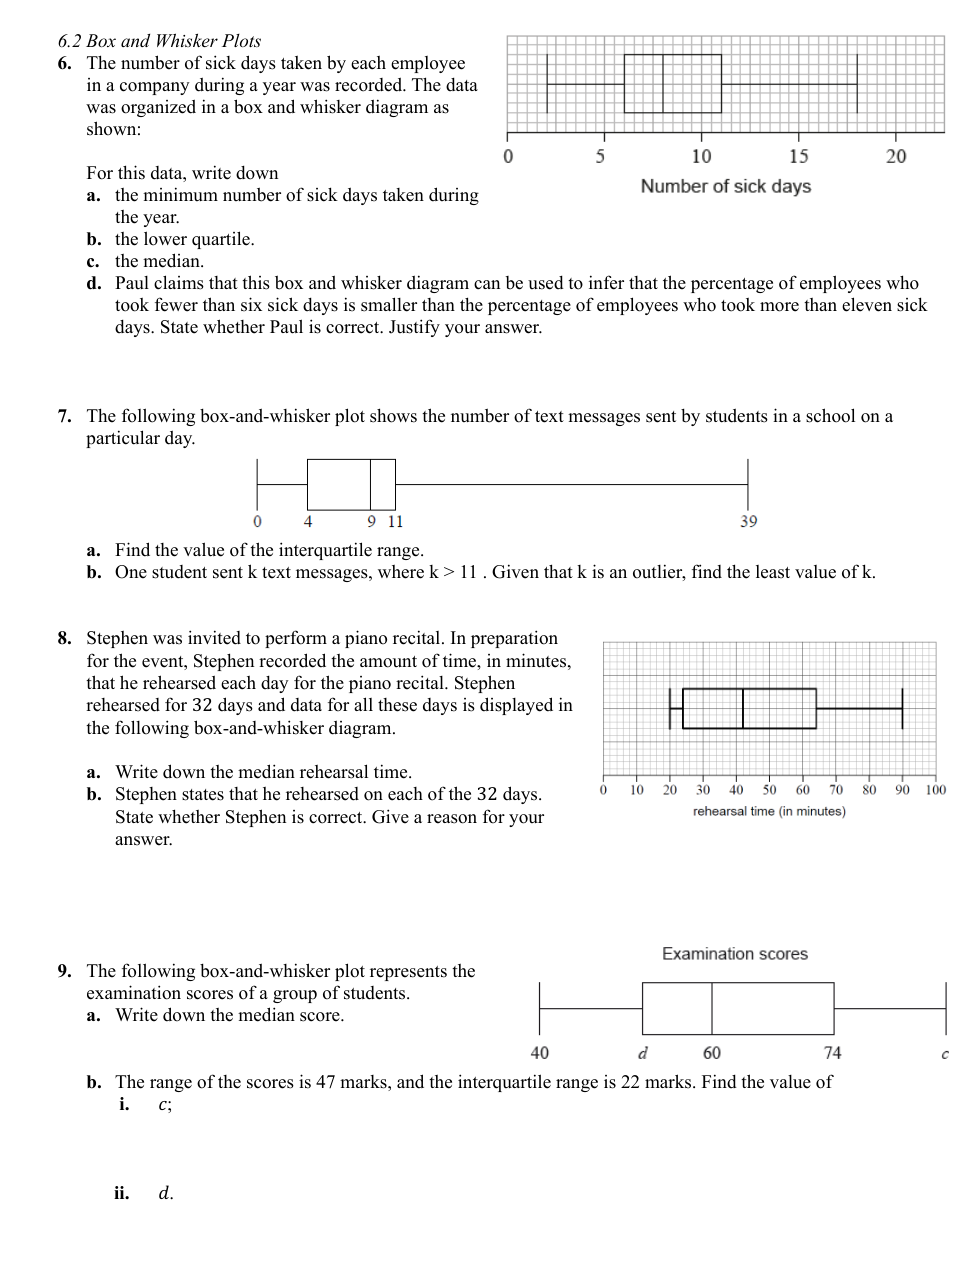
The minimum numbers of sick days taken during the year.
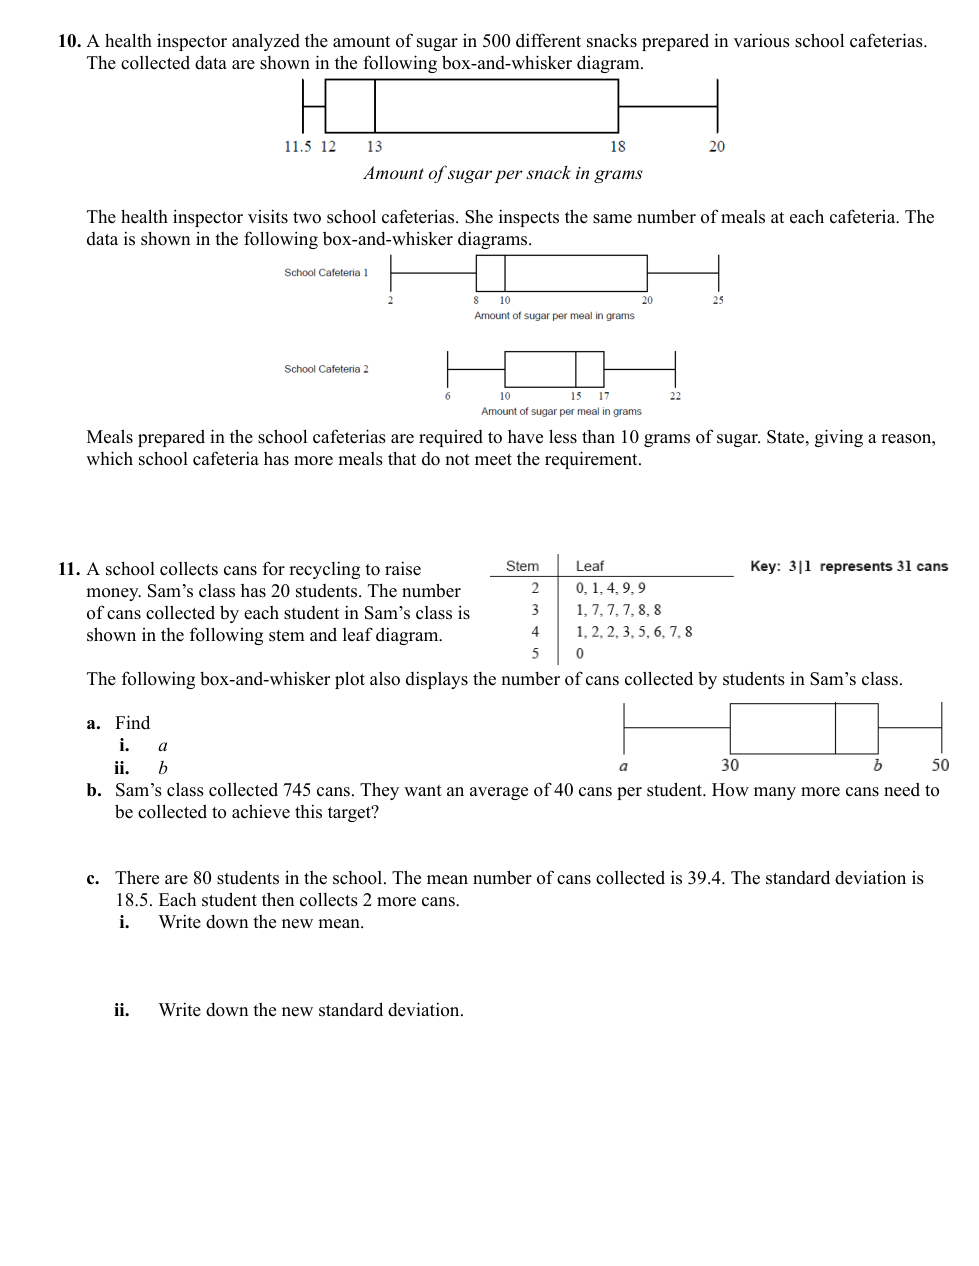
Meals prepared in the school cafeterias are required to have less than 10 grams of sugar. State, giving a reason, which school cafeteria has more meals that do not meet the requirement.
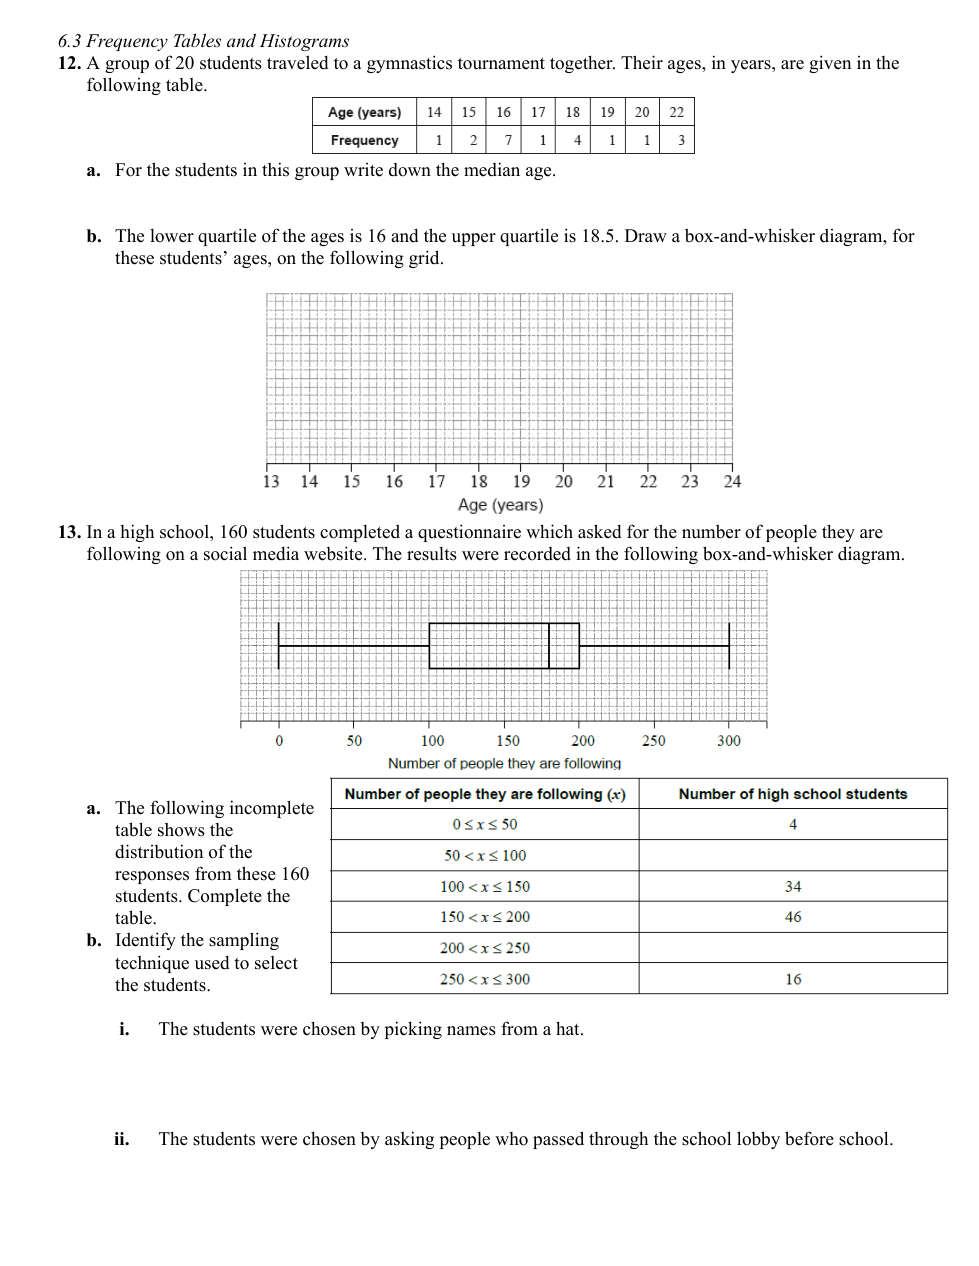
For the students in this group write down the median age.
Complete the table.
The students were chosen by picking names from a hat.
The students were chosen by asking people who passed through the school lobby before school.
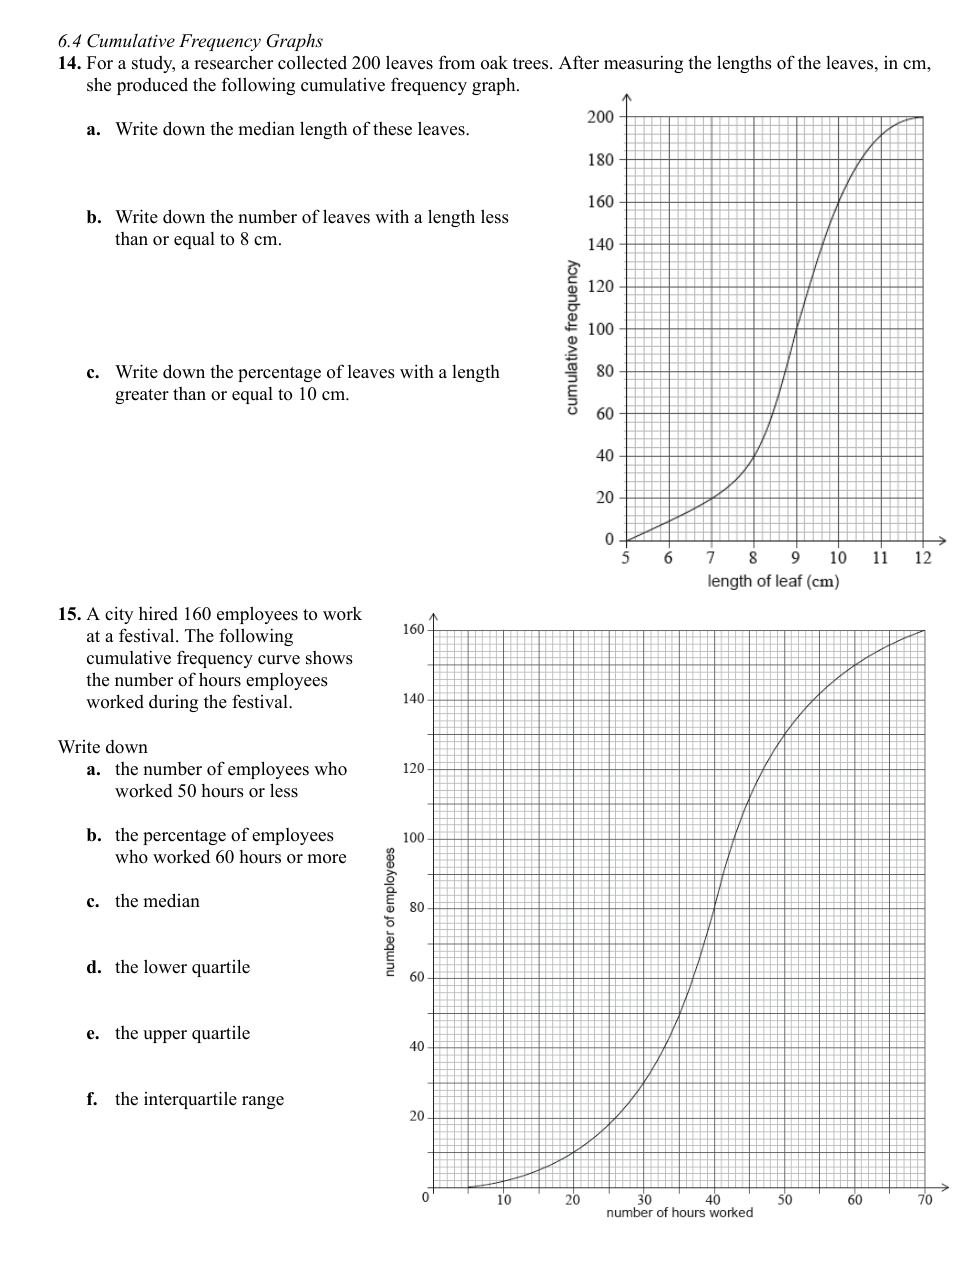
Write down the median length of these leaves.
Write down the number of leaves with a length less than or equal to 8 cm.
Write down the percentage of leaves with a length greater than or equal to 10 cm.
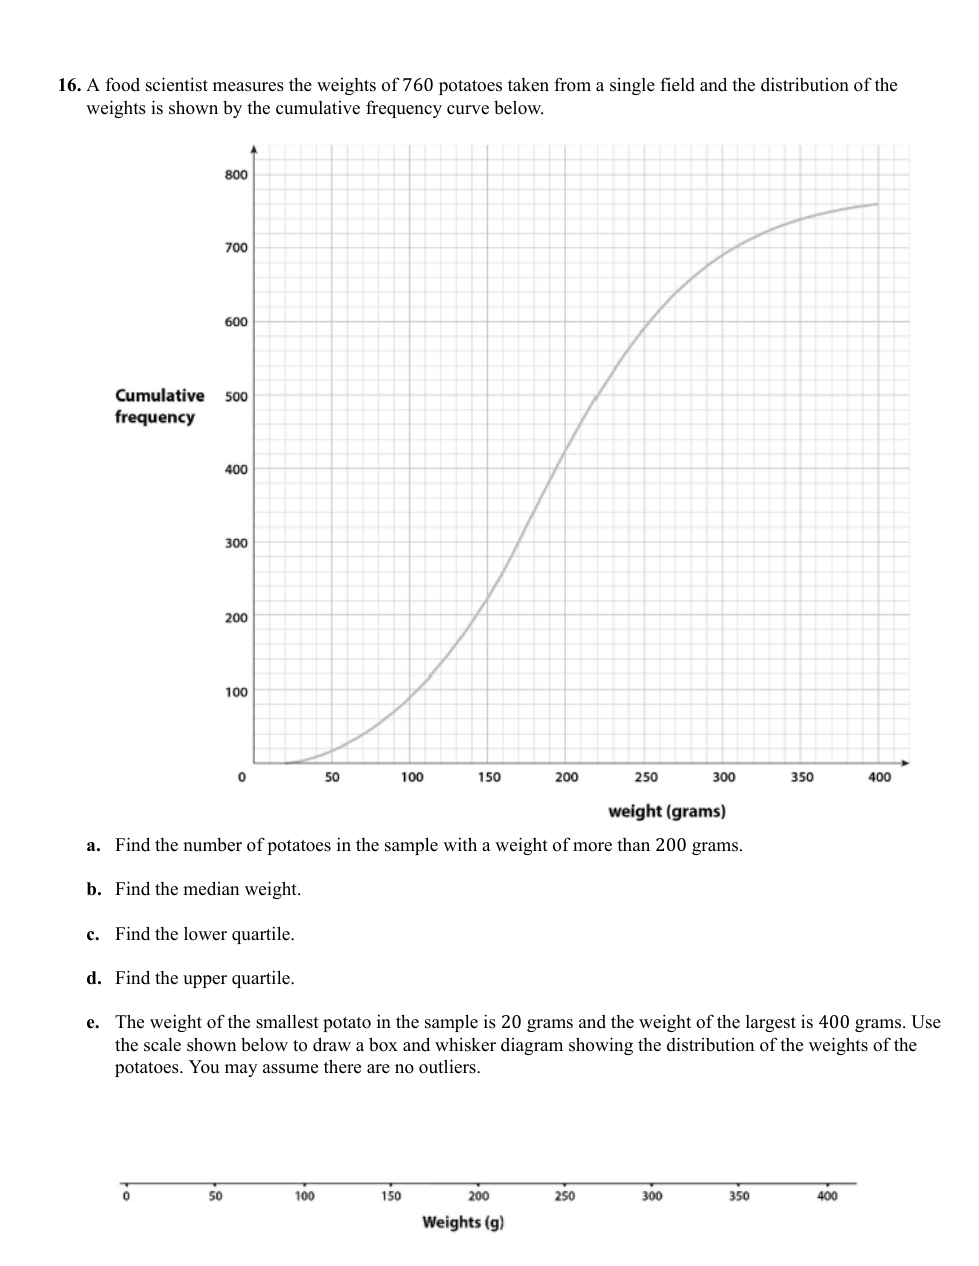
Find the number of potatoes in the sample with a weight of more than 200 grams.
Find the median weight.
Find the lower quartile.
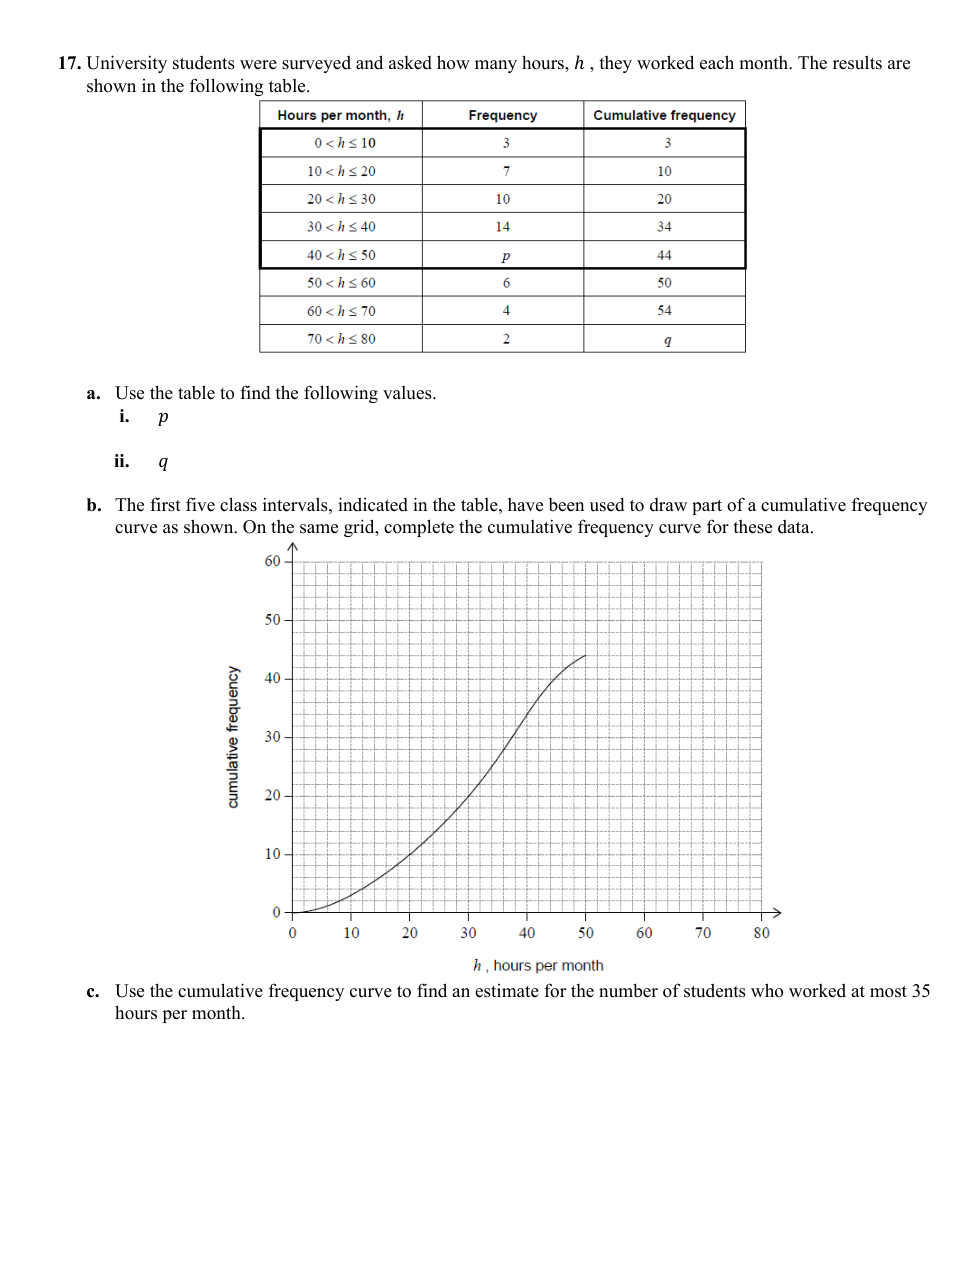
p
q
Use the cumulative frequency curve to find an estimate for the number of students who worked at most 35 hours per month.
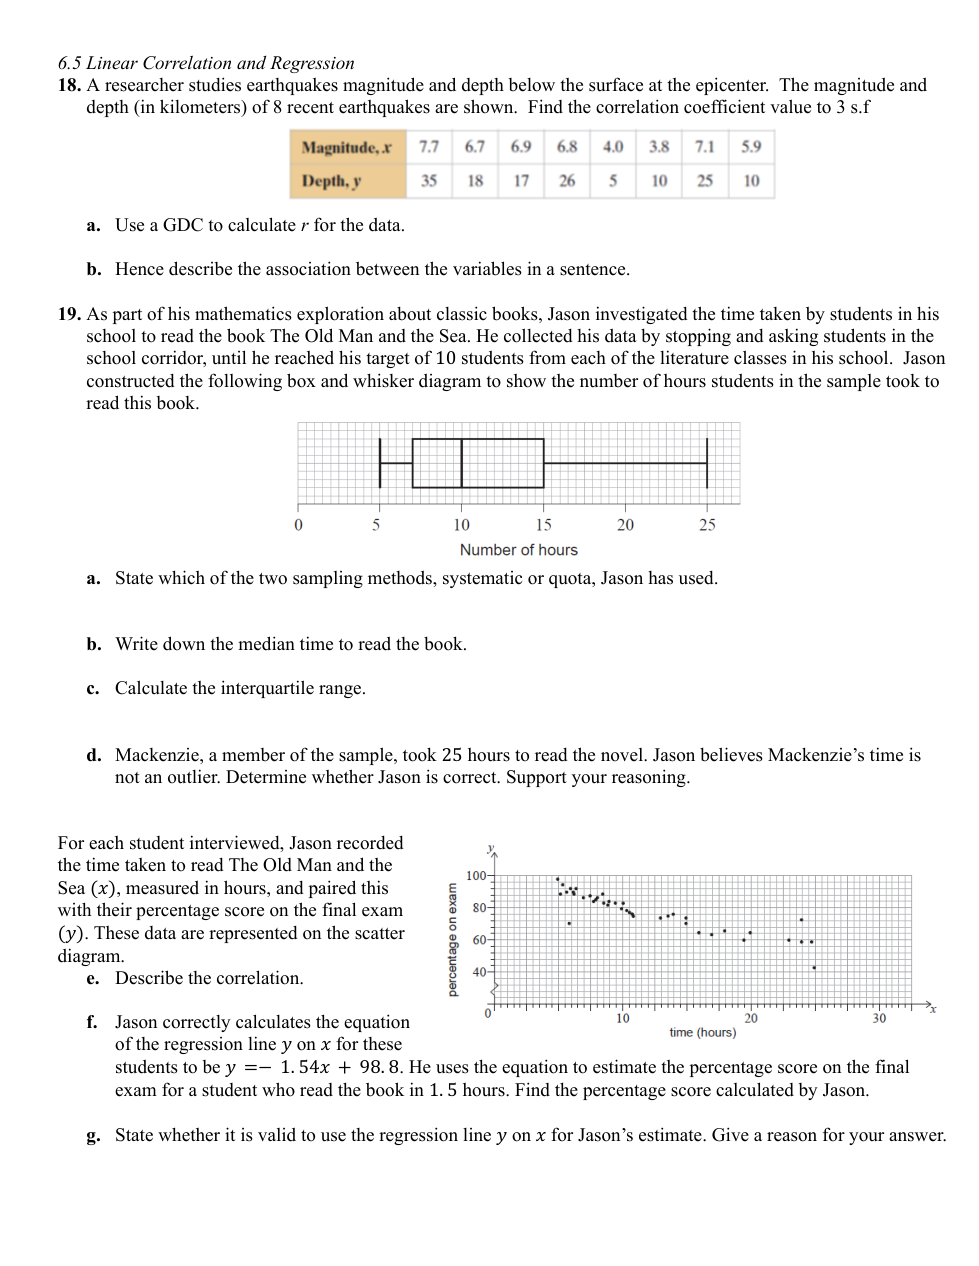
Use a GDC to calculate r for the data.
Hence describe the association between the variables in a sentence.
The standard deviation.
Find the value of x.
Find the standard deviation
Find the interquartile range.
Find the mean.
Write down the value of the new mean.
Find the value of the new variance.
Mean.
Median.
Find the mean number of hours spent browsing the Internet.
The mean.
The standard deviation.
The lower quartile.
The median.
Paul claims that this box and whisker diagram can be used to infer that the percentage of employees who took fewer than six sick days is smaller than the percentage of employees who took more than eleven sick days. State whether Paul is correct. Justify your answer.
Find the value of the interquartile range.
One student sent k text messages, where
Write down the median rehearsal time.
Stephen states that he rehearsed on each of the 32 days. State whether Stephen is correct. Give a reason for your answer.
Write down the median score.
Find the value of c;
Find the value of d;
Find a.
Find b.
Sam’s class collected 745 cans. They want an average of 40 cans per student. How many more cans need to be collected to achieve this target?
the number of employees who worked 50 hours or less
the percentage of employees who worked 60 hours or more
Find the upper quartile.
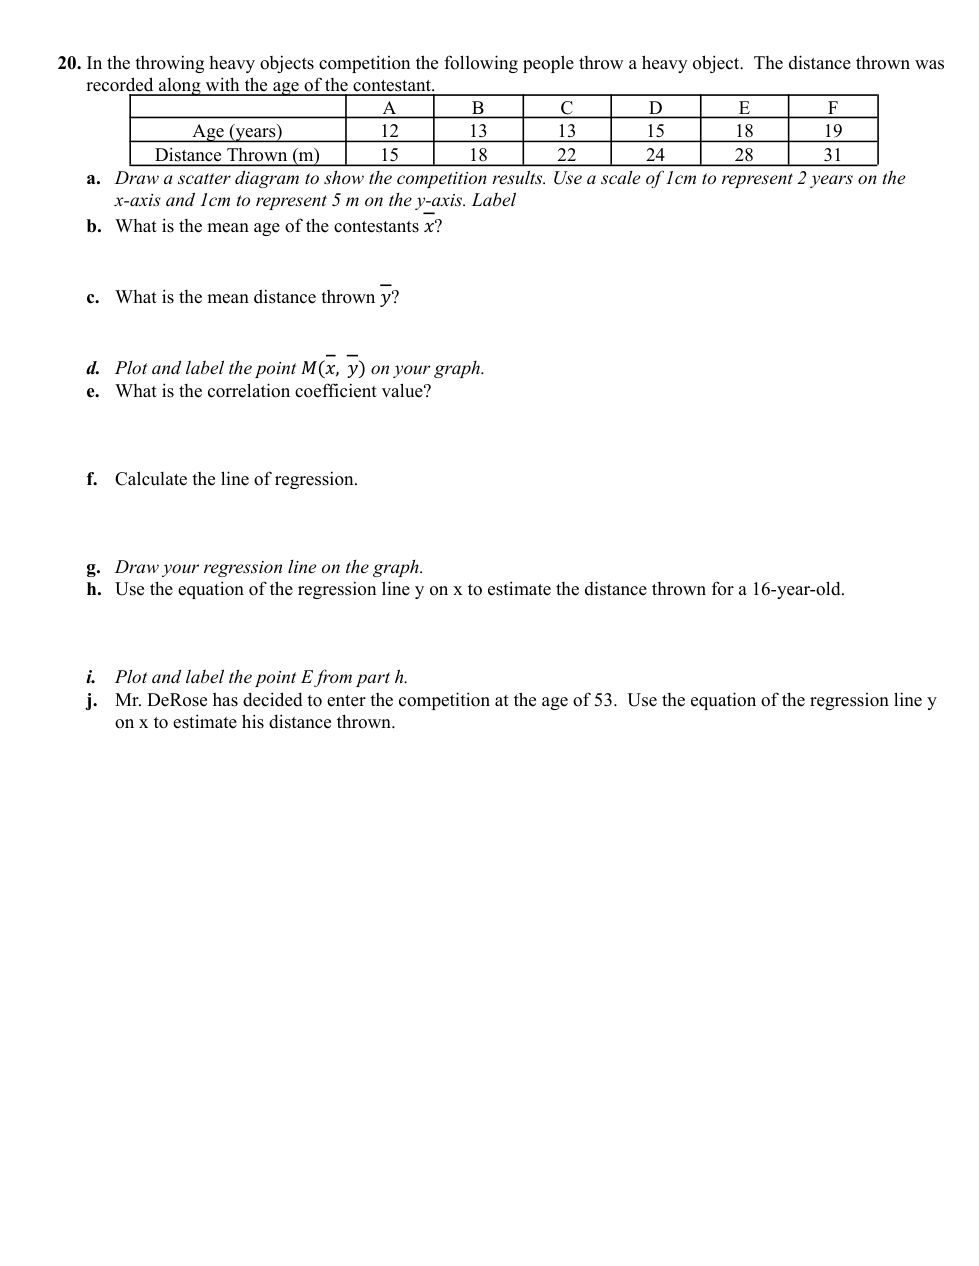
What is the mean age of contestants
What is the mean distance thrown
Range
IQR
Standard deviation.
Variance
The median.
The variance.
Write down the new mean.
Write down the new standard deviation.
the median
the lower quartile
the upper quartile
the interquartile range
State which of the two sampling methods, systematic or quota, Jason has used.
Write down the median time to read the book.
Calculate the interquartile range.
Mackenzie, a member of the sample, took 25 hours to read the novel. Jason believes Mackenzie’s time is not an outlier. Determine whether Jason is correct. Support your reasoning.
Describe the correlation.
Find the percentage score calculated by Jason.
State whether it is valid to use the regression line y on x for Jason’s estimate. Give a reason for your answer.
What is the correlation coefficient vale?
Calculate the line of regression.
Use the equation of the regression line y on x to estimate the distance thrown for a 16-year-old.
Mr. DeRose has decided to enter the competition at the age of 53. Use the equation of the regression line y on x to estimate his distance thrown.