Base your answers to questions 21 through 26 on the information below and on your knowledge of Earth and Space Sciences. Some questions may require the use of the 2024 Edition Reference Tables for Earth and Space Sciences.
How Did Earth Get Its Water?
Scientists are unsure about where and how Earth got its water. Early Earth lacked an atmosphere and was very hot, so water would not have formed in such an environment. One theory is that water was brought to Earth when comets collided with Earth, since comets are made of frozen water, gases, and dust.
Another theory centers around asteroids. Earth is believed to have formed from the clumping together of space debris. These early solar system materials contained the elements hydrogen and oxygen. The chemical proportions of the water found on asteroids are similar, though different, from Earth’s water.
The most recent discoveries have come from studies of dust particles brought back to Earth from the Hokawa asteroid. The particles were found to have water and an oxygen-hydrogen ion. The source of the hydrogen is believed to be from solar wind — hydrogen ions ejected from the Sun streaming through space and lodging onto the surface of dust particles. These particles have been falling to Earth since the solar system formed. The space dust is believed to have provided about 50% of Earth’s water.
The graph below shows the relative deuterium-to-hydrogen ratio (D/H) in water found in solar system objects. Diamond symbols are measurements obtained by satellites. Dots are estimated values. Deuterium is a “heavier” form of hydrogen. This ratio is an important factor in determining where in the solar system an object formed and how asteroids, comets, and the solar wind contributed to the water in Earth’s oceans.

Earth’s first significant atmosphere was formed from the release of gases from volcanic eruptions, when the mantle is believed to have been molten. Gases from the interior were released and accumulated into a gaseous surface layer trapped by gravitational forces. Solar wind from the Sun swept the light gases (hydrogen and helium) away, leaving behind heavier gases in the early atmosphere. The models below show gases entering Earth’s atmosphere at two different times.

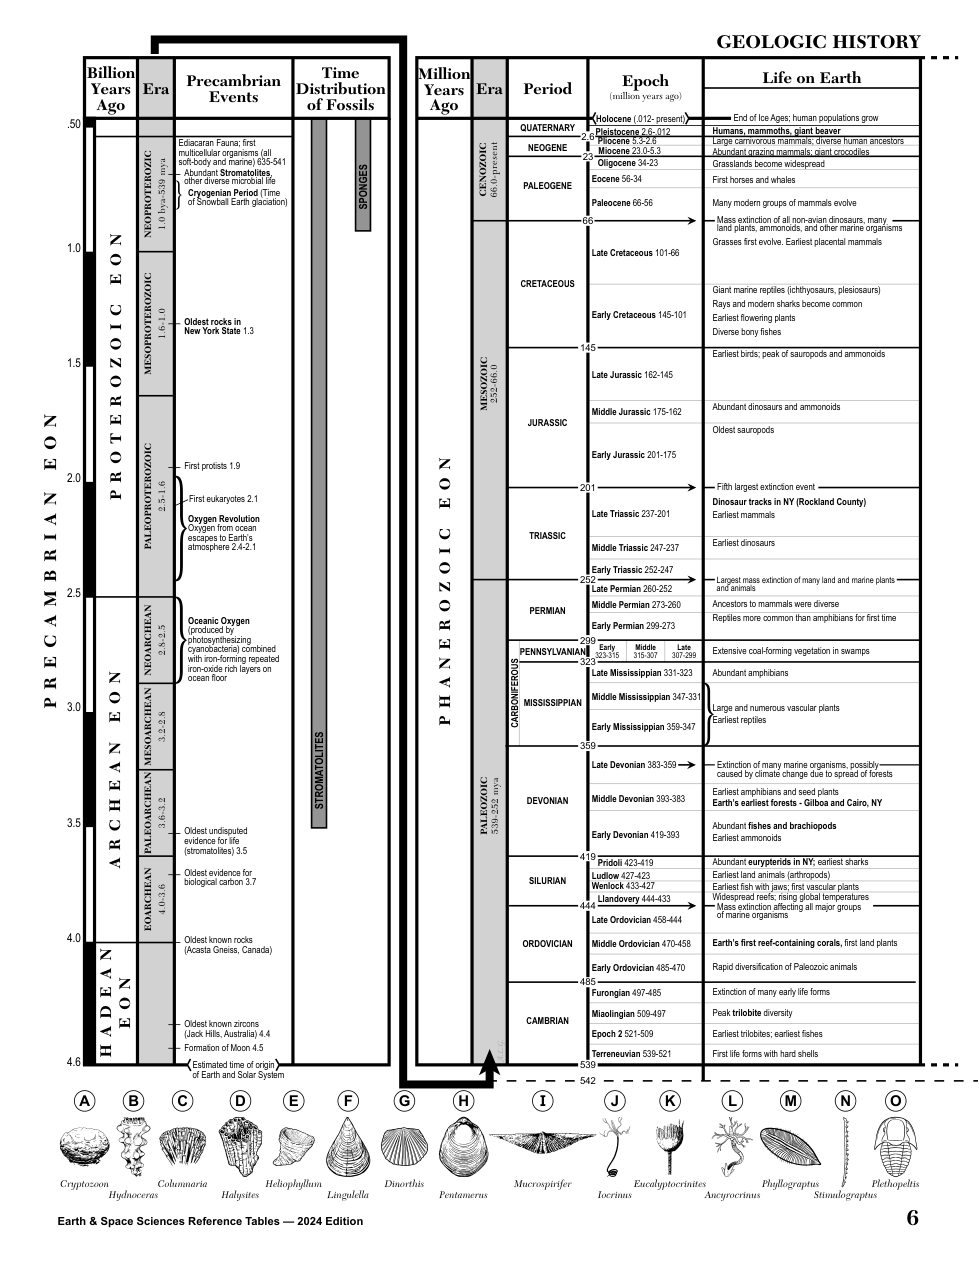
The water in Earth’s early oceans provided the necessary environment for life about 3 to 3.5 billion years ago. Organisms such as stromatolites were the earliest example of life on Earth and were capable of photosynthesis. From about two billion years ago to 500 million years ago, Earth’s atmosphere changed significantly, driven by an increase of many different life forms. Living and fossilized stromatolites can still be found today in Australia.

As life on Earth evolved and expanded onto land, fresh water became a vital resource. This is especially true for humans who use fresh water in a variety of ways. Humans have caused changes in land use through deforestation, agricultural expansion, and urbanization. These changes can impact soil in both positive and negative ways. The graph below shows some information about factors that affect erosion.

In areas where human population density is high, managing fresh water availability is essential. A large, underground store of water is called an aquifer. One of the most important aquifers in New York State is beneath Long Island and supplies 400 million gallons of water per day to over 2.8 million people. The cross section below represents water cycle processes for the Long Island area. The three aquifers (Upper Glacial, Magothy, and Lloyd) and sediment or rock layers that together make up the larger Long Island aquifer region are shown.

A period of drought occurs when the amount of rainfall an area receives and the amount of precipitation that eventually infiltrates into the ground to reach an aquifer is greatly reduced. When Long Island aquifers experience periods of drought or over-pumping from water wells, salt water from the Atlantic Ocean can intrude into the aquifer, polluting the fresh water.


 Calthemite straws are deposits found on the underside of concrete structures such as parking garages. Calthemites are not considered stalactites, as they do not form naturally in caves and cavern systems. The series of photographs below shows the growth of a calthemite straw measured in millimeters (mm).


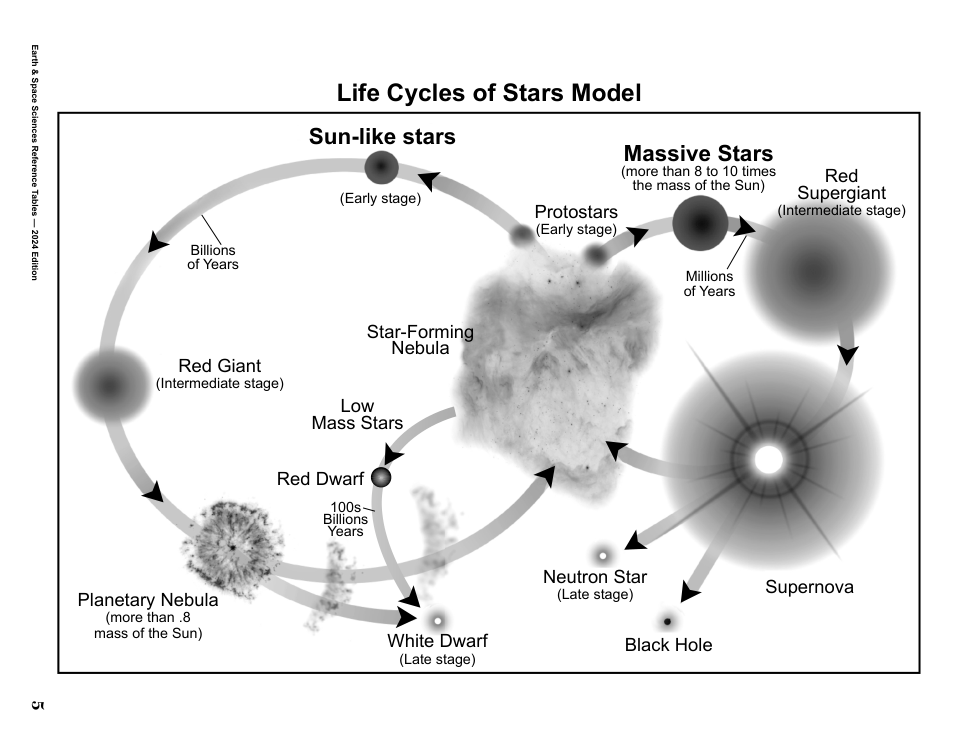
 The only evidence astronomers have for the first stars that formed is the electromagnetic radiation they left behind. Telescopes like Hubble can detect objects billions of light-years away (billions of years back in time).

 The orbital motions of satellites, natural or human-made, are determined by the strength of the gravitational fi eld at the satellite’s location. The model below shows the formula used to calculate the strength of Earth’s gravitational field for Earth’s satellites.


 The model below shows the pH scale (0–14) that is a measure of the acidity or alkalinity of water. The graph below shows some information about the pH of ocean water.

