1
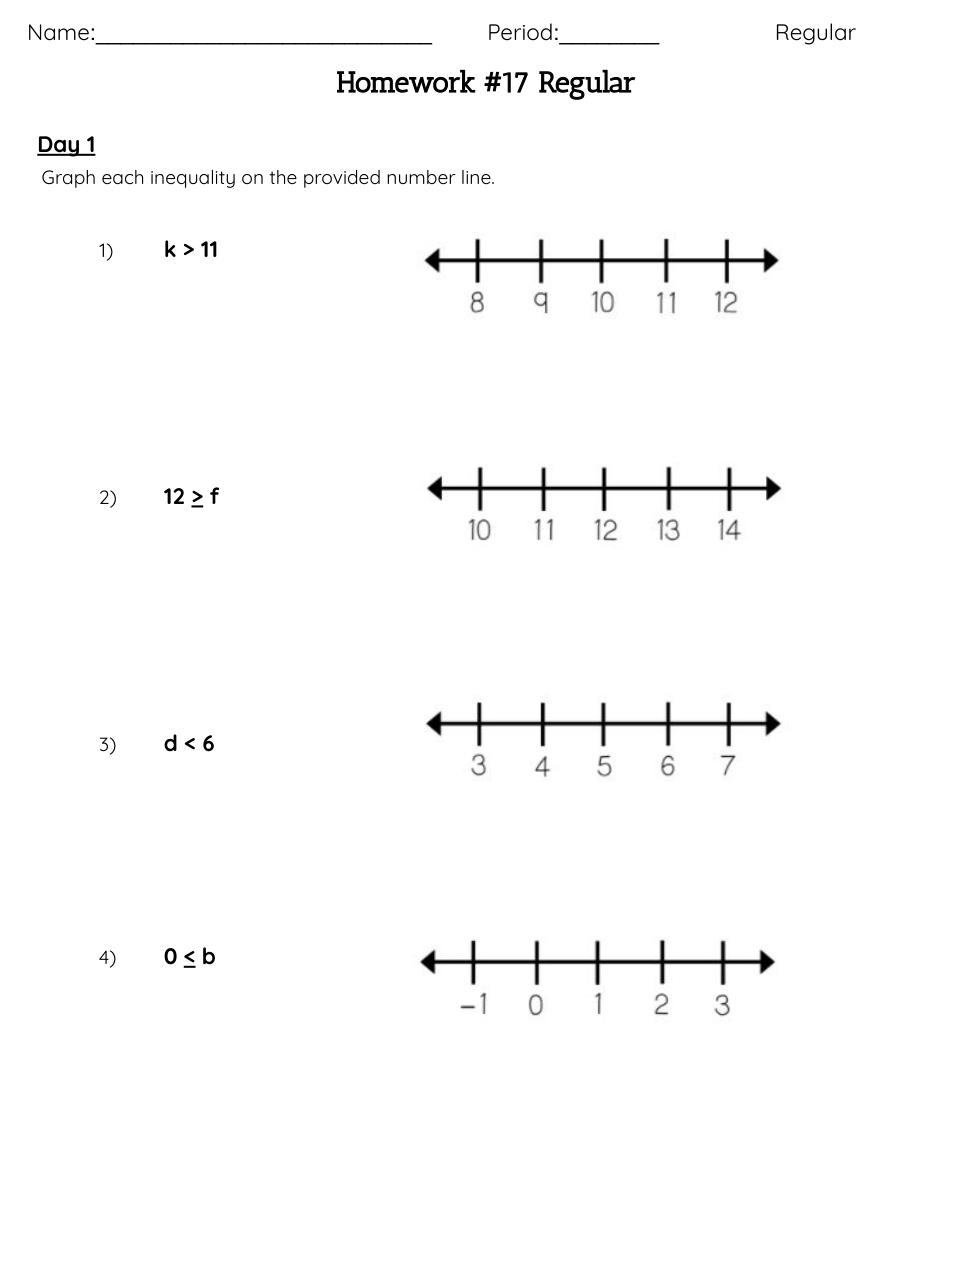
Explain what the graph of the inequality would look like.
circle on 11.
Ray points to the .
1
Explain what the graph of the inequality would look like.
circle on 12.
Ray points to the .
1
Explain what the graph of the inequality would look like.
circle on 6.
Ray points to the .
1
Explain what the graph of the inequality would look like.
circle on 6.
Ray points to the .