


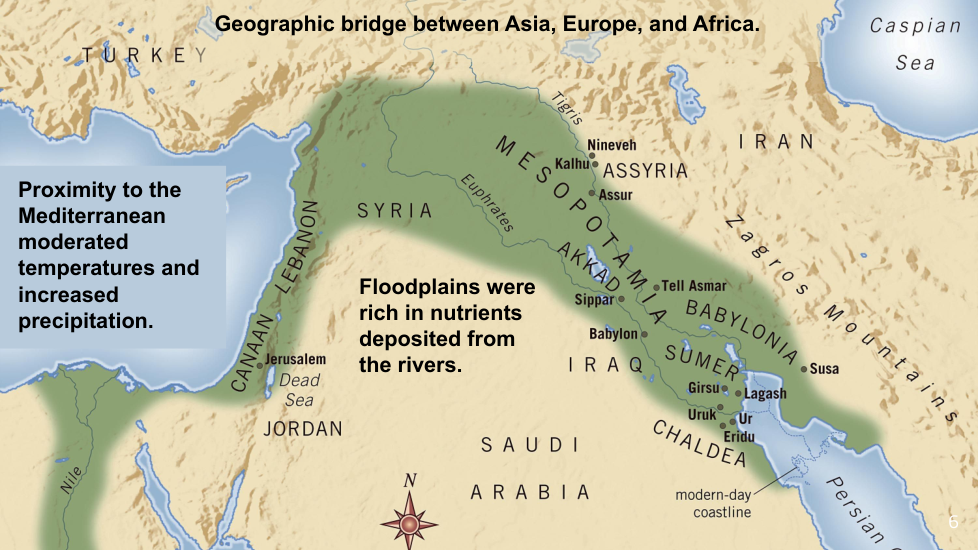
Why were Mesopotamian floodplains fertile?
What is plowing primarily used for in agriculture?
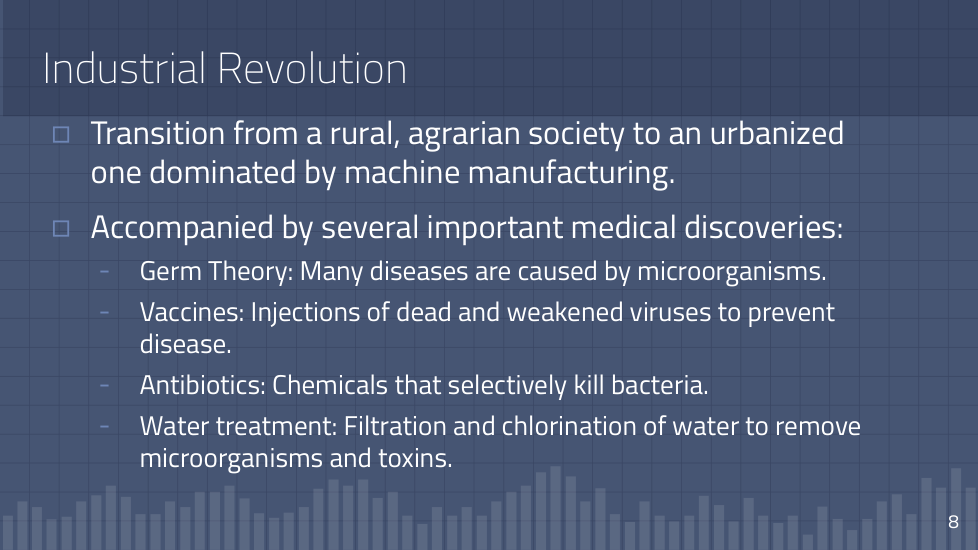
What does Germ Theory suggest about diseases?
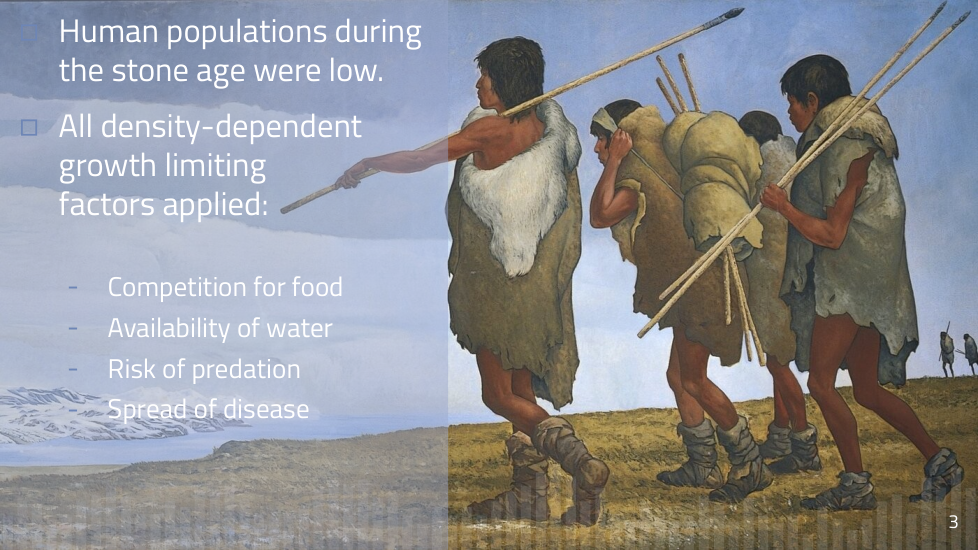
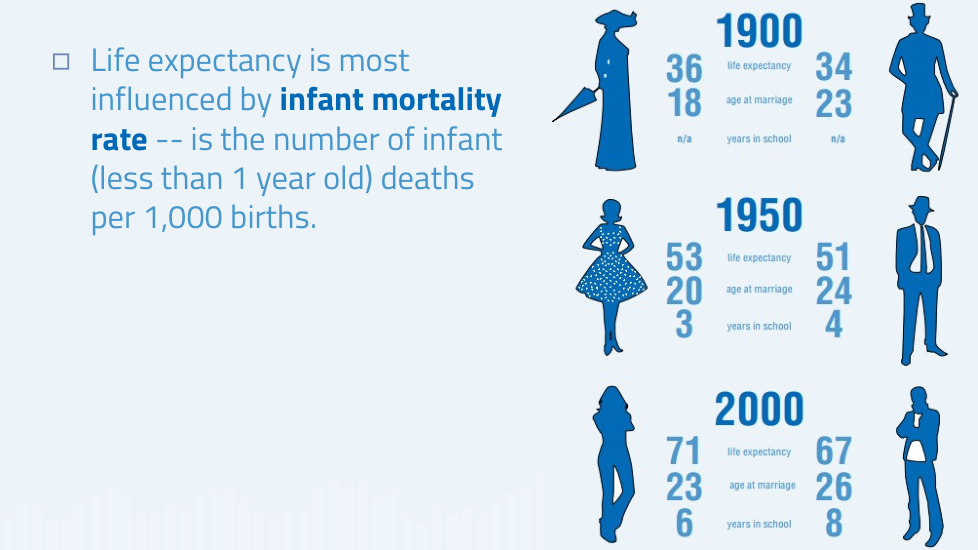
What factor most affected early human population growth?
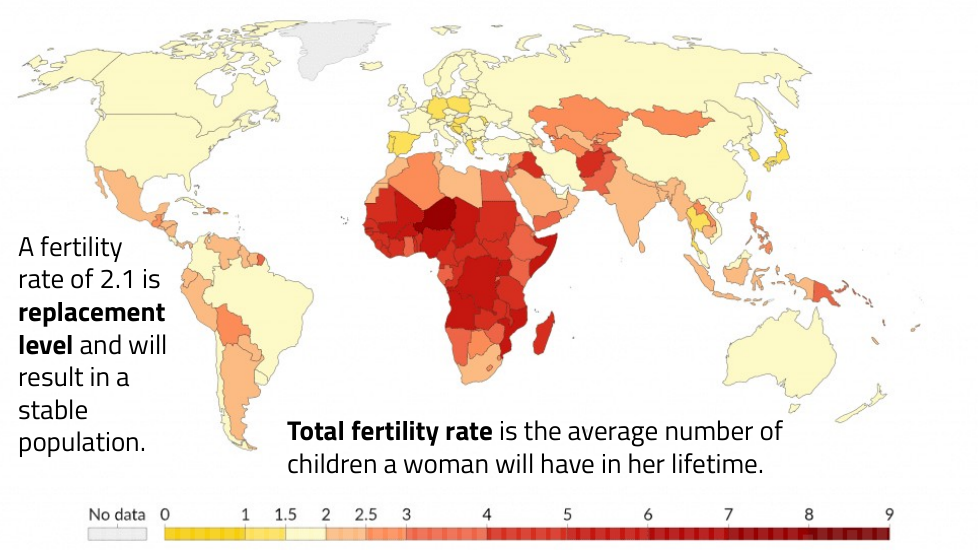
What is the replacement level fertility rate?
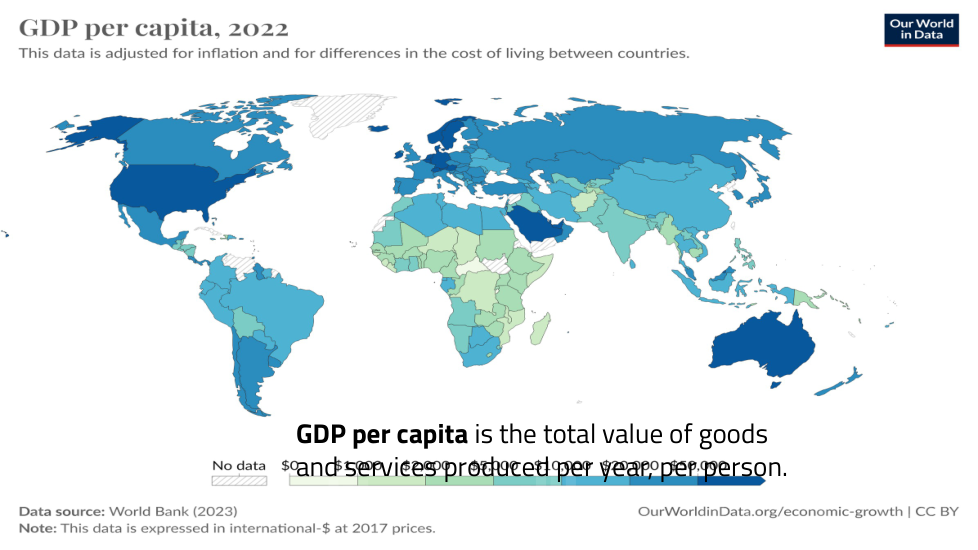
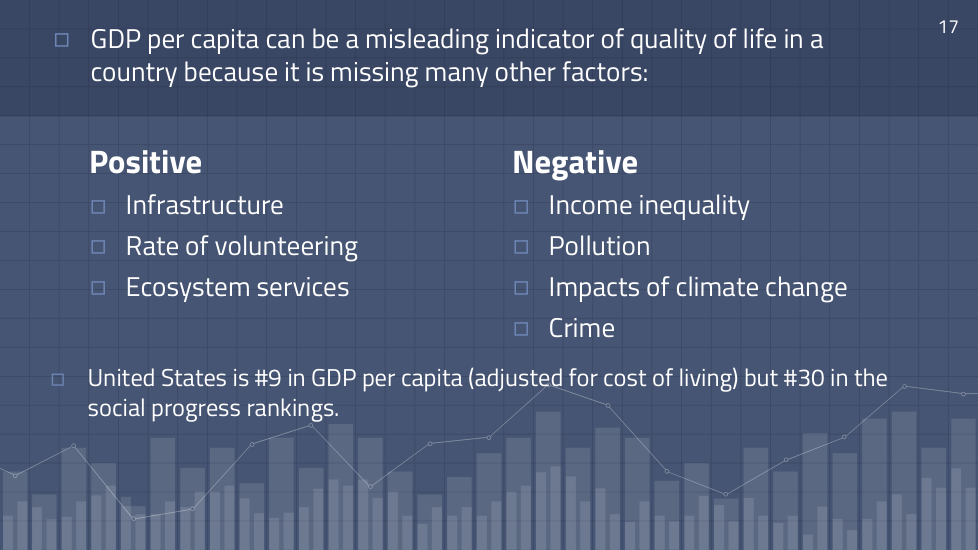
What does GDP per capita fail to consider in quality of life?
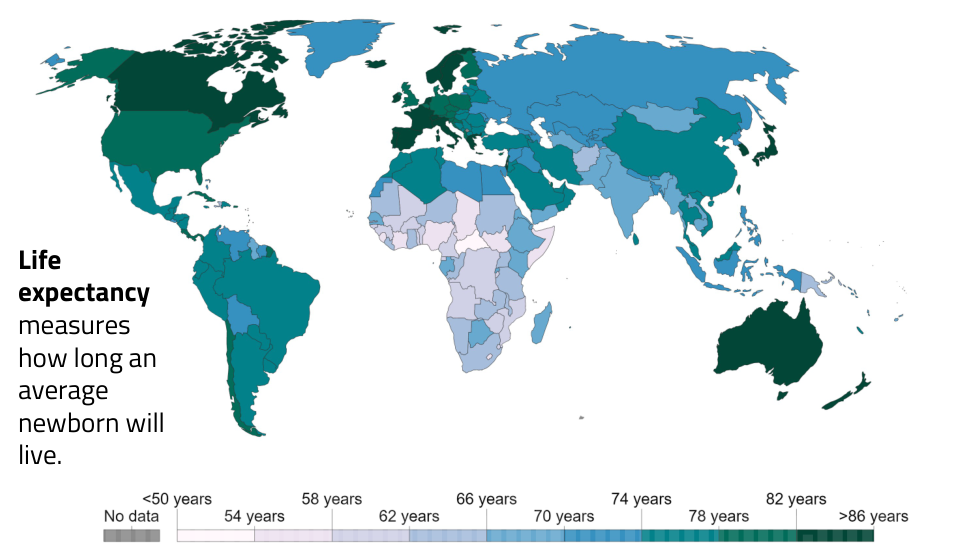
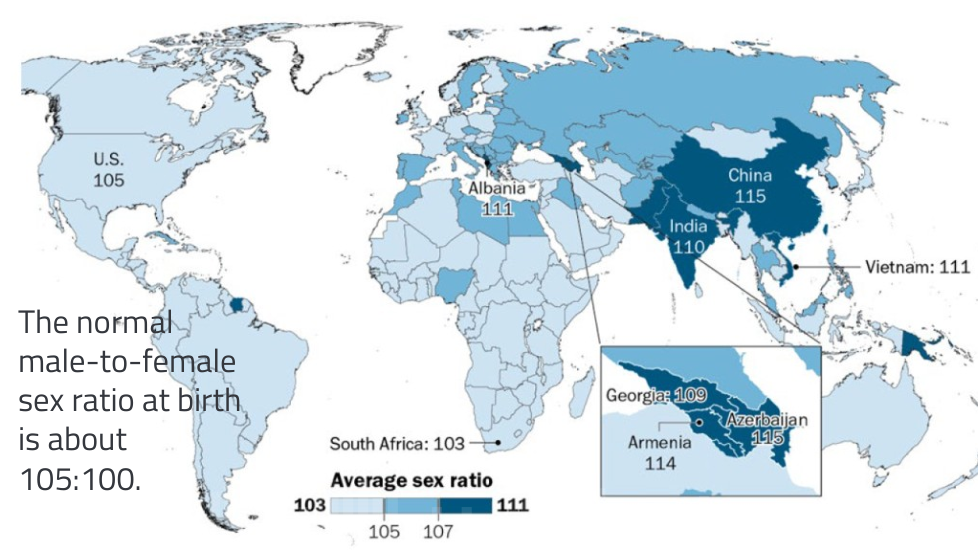
What does a dark color indicate on this map?
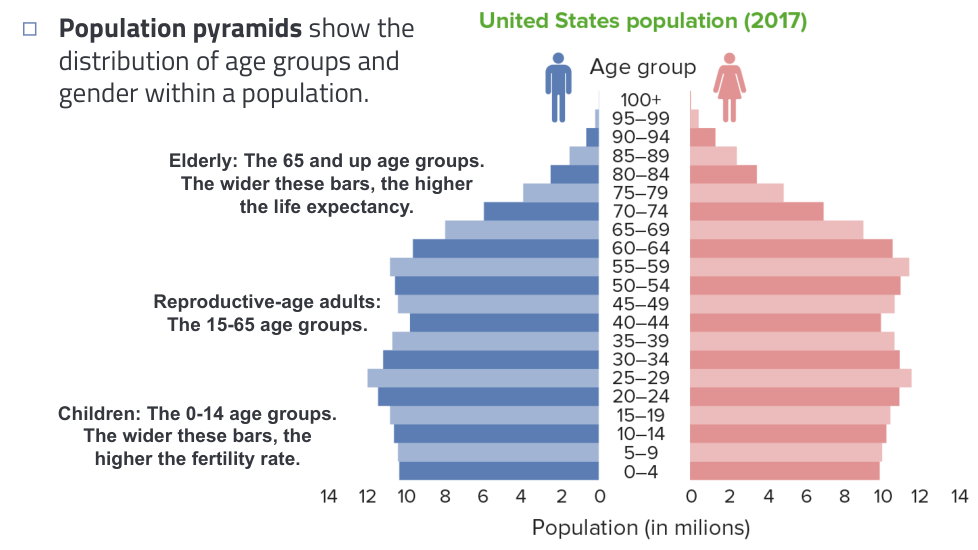
What do wider bars in the elderly age group indicate?
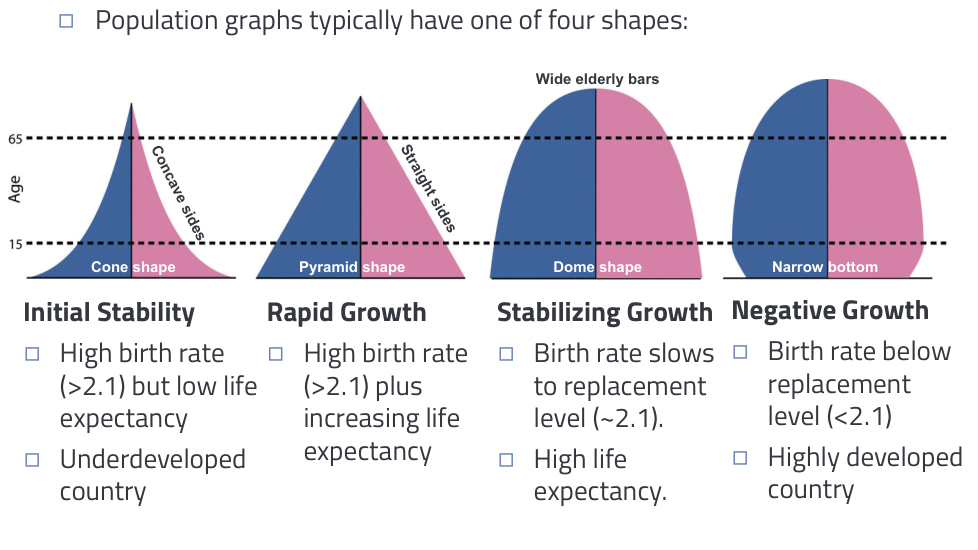
What shape is typical of countries with low life expectancy?
What happens to the death rate during the industrial stage?
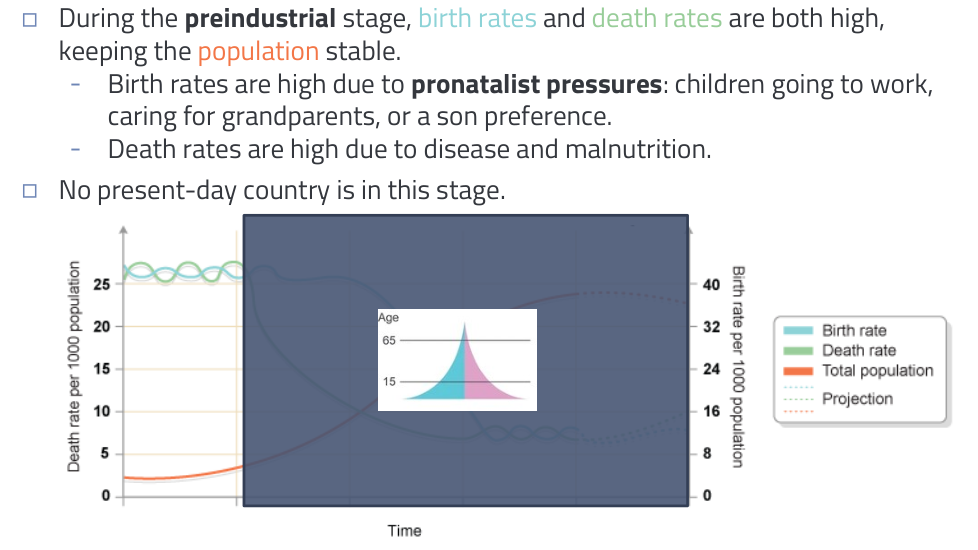
What characterizes the preindustrial stage of population growth?
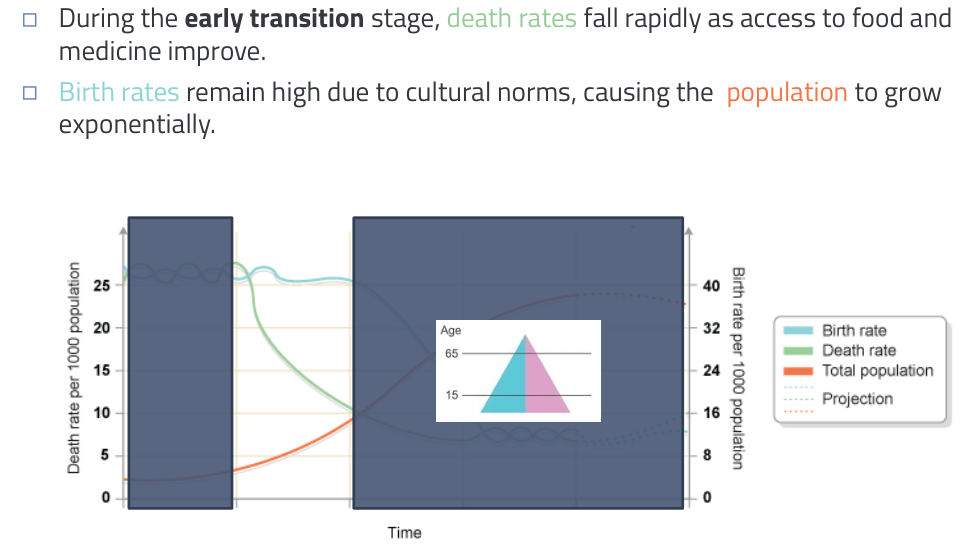
What happens to death rates during the early transition stage?
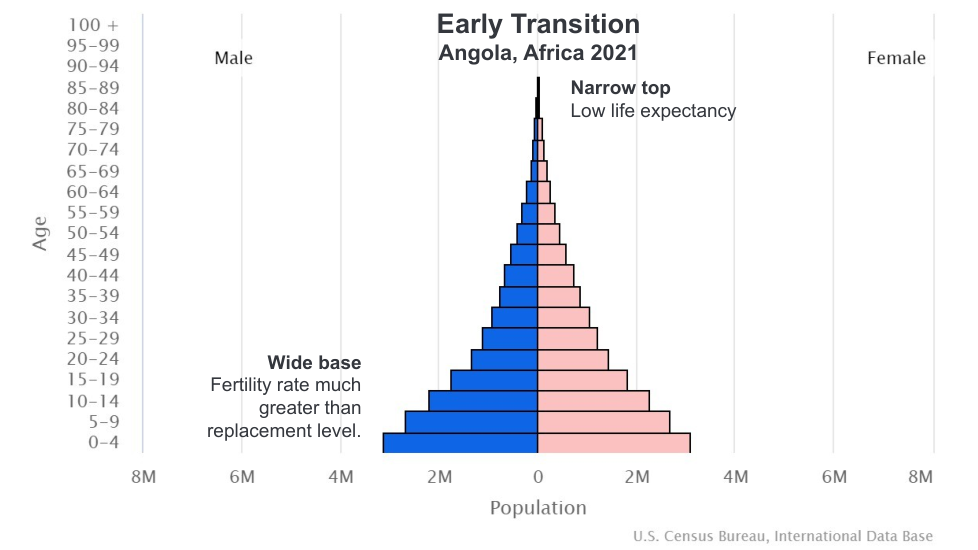
What does a wide base in a population pyramid indicate?
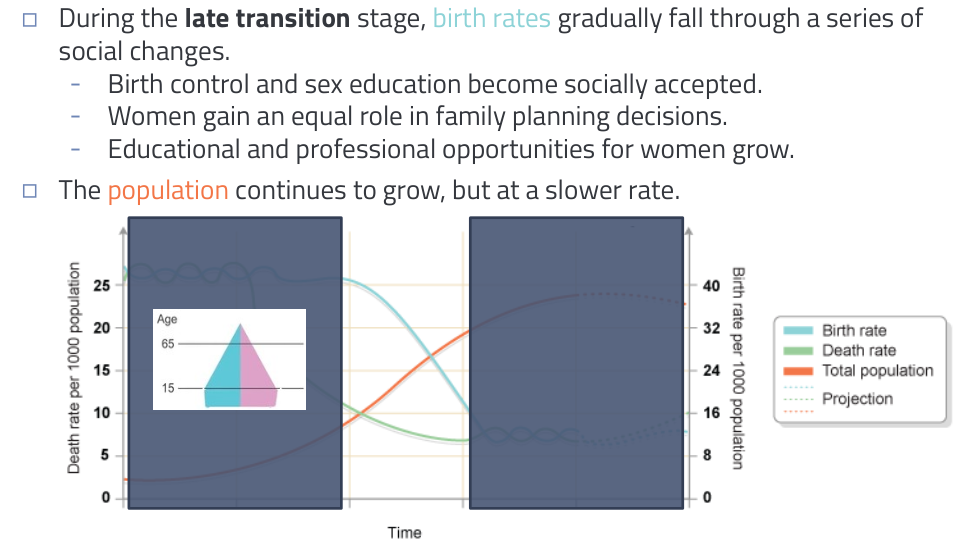
What happens to birth rates during the late transition stage?
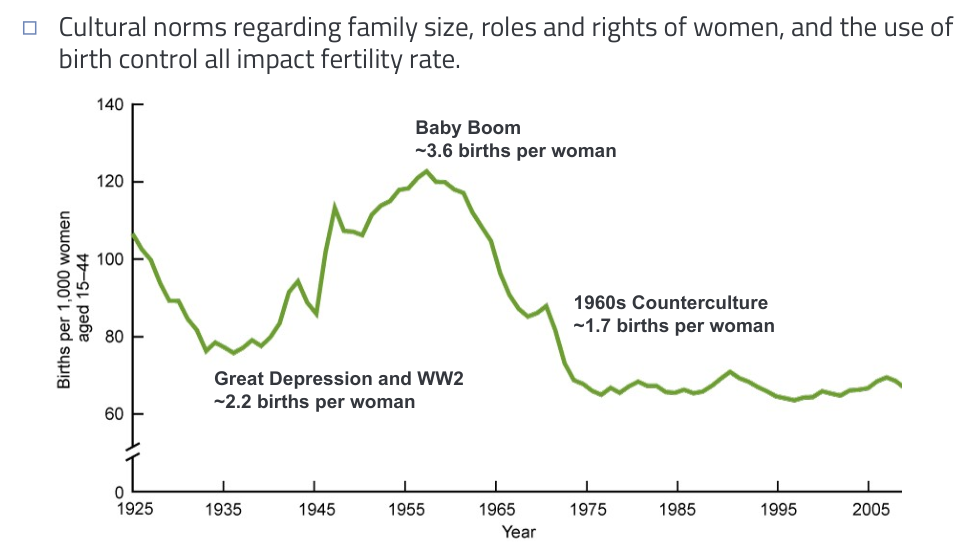
What event caused a significant baby boom in the U.S.?
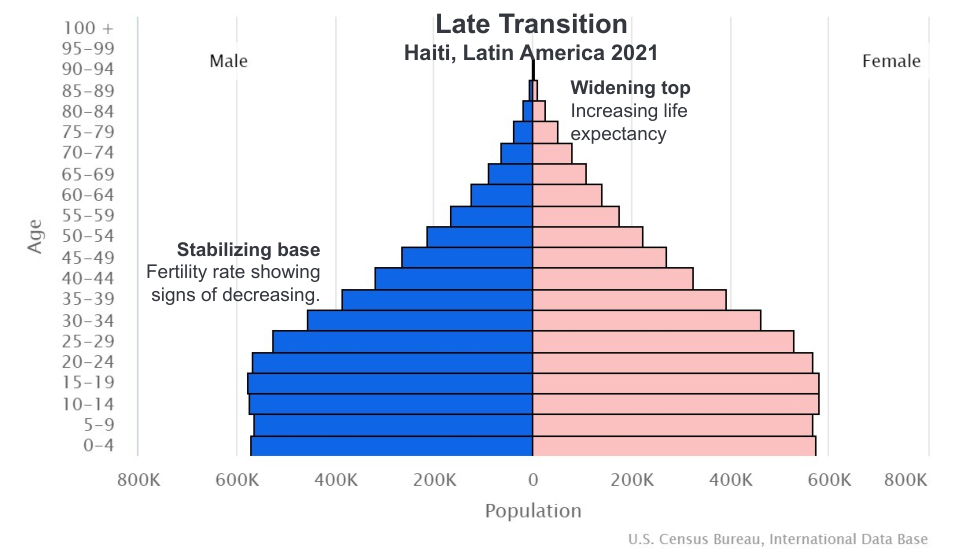
What does a widening top in a population pyramid imply?
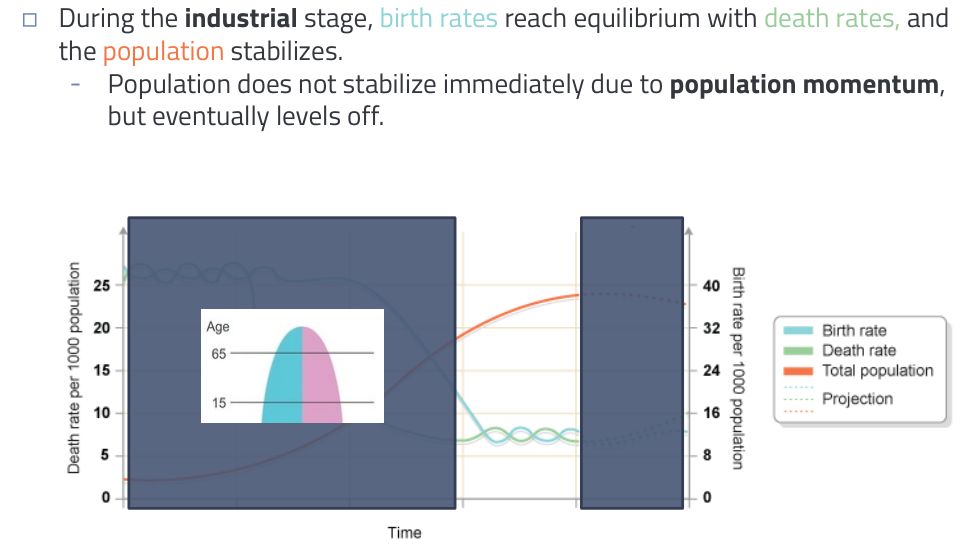
What happens to birth rates during the industrial stage?
What does a population pyramid represent?
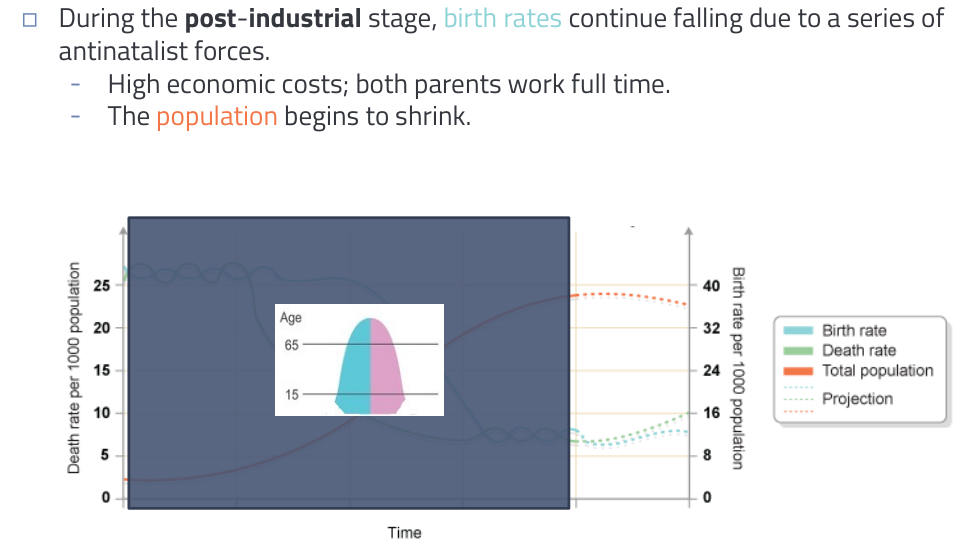
What occurs to birth rates during the post-industrial stage?
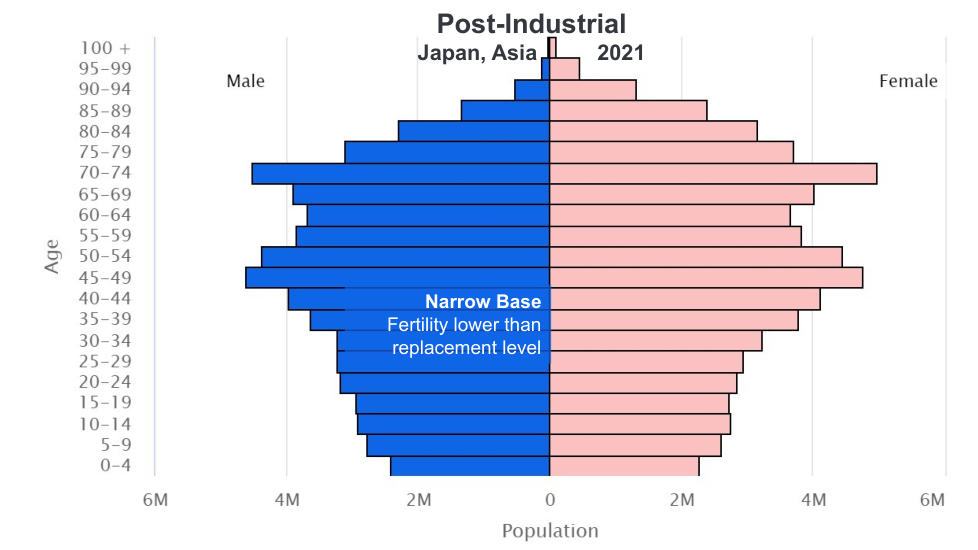
What does a narrow base in a population pyramid indicate?
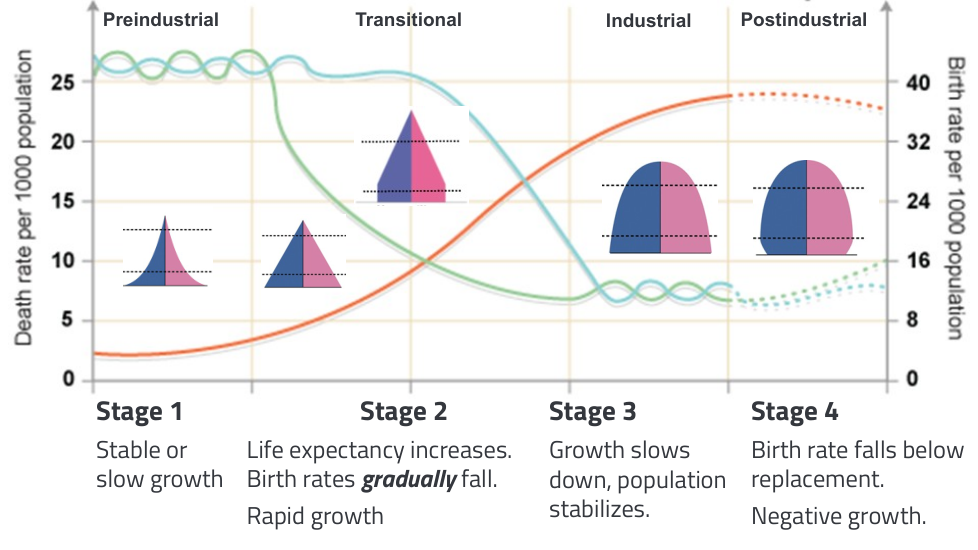
What characterizes the transitional stage of population growth?
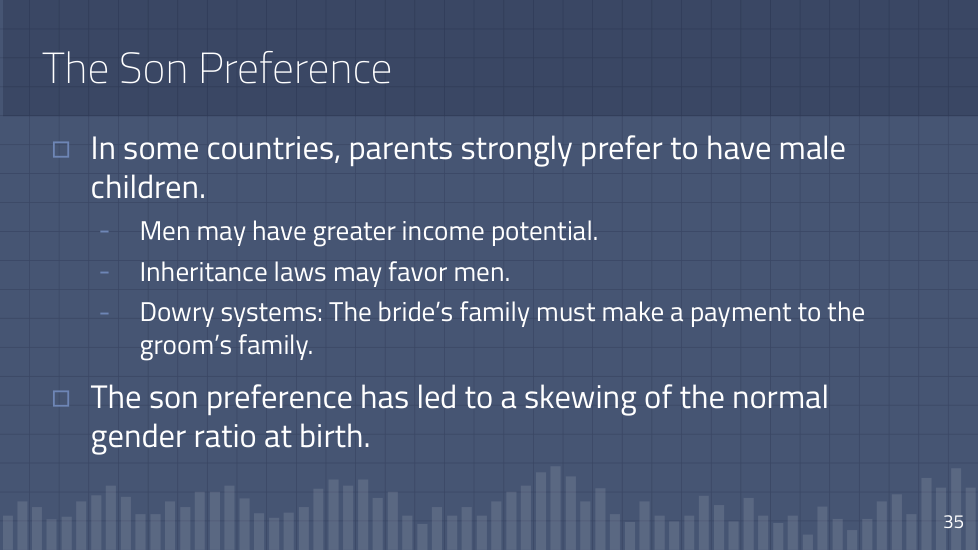
Why do some parents prefer male children?
What year did China implement the one-child policy?
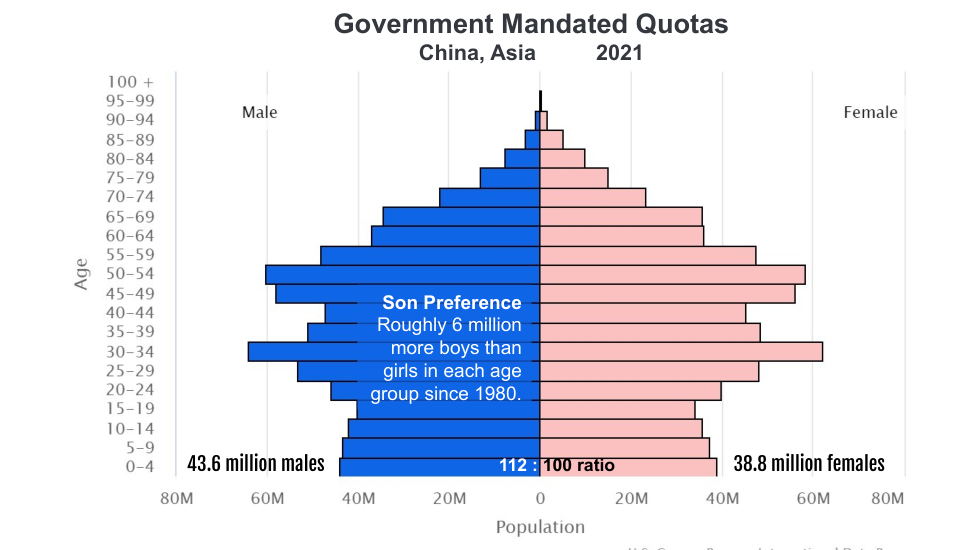
What is the male-to-female ratio in China as of 2021?

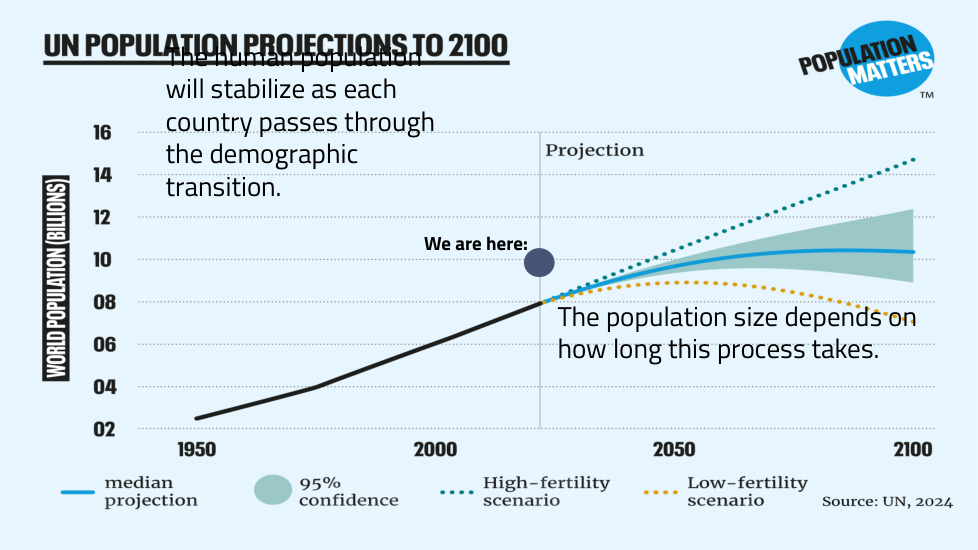
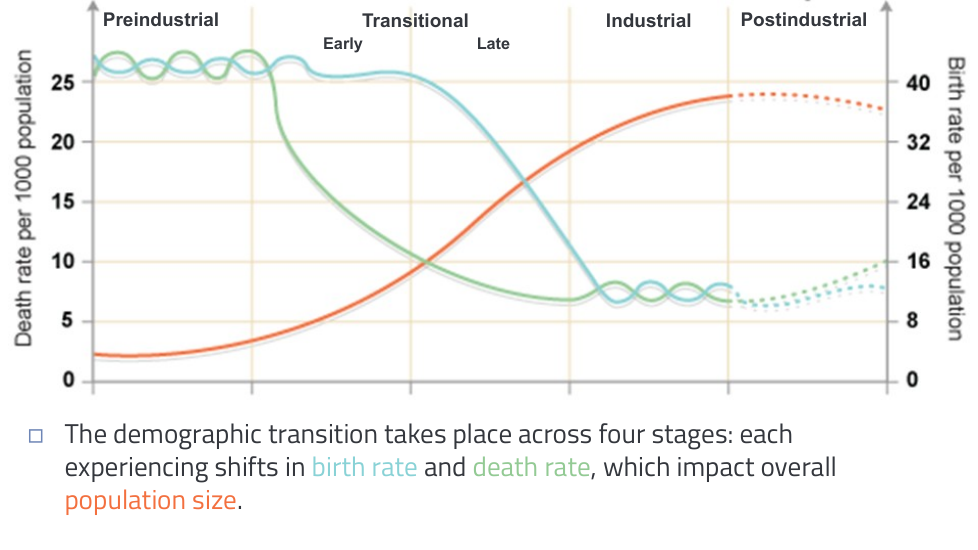
What does the 'demographic transition' refer to?
How did the Mediterranean affect the climate of Mesopotamia?
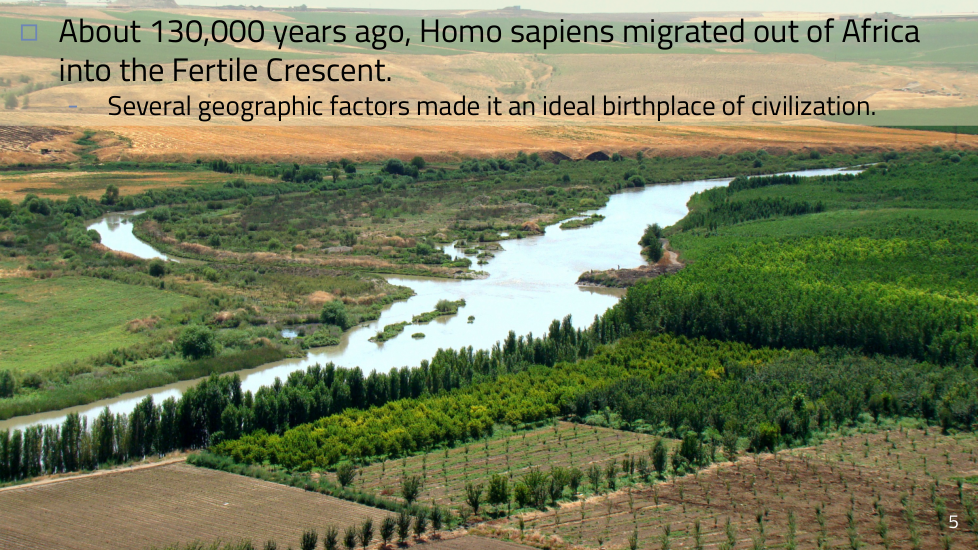
What geographic significance does Mesopotamia hold?
What does breeding involve in agricultural practices?
Which revolution marked the shift from gathering to farming?
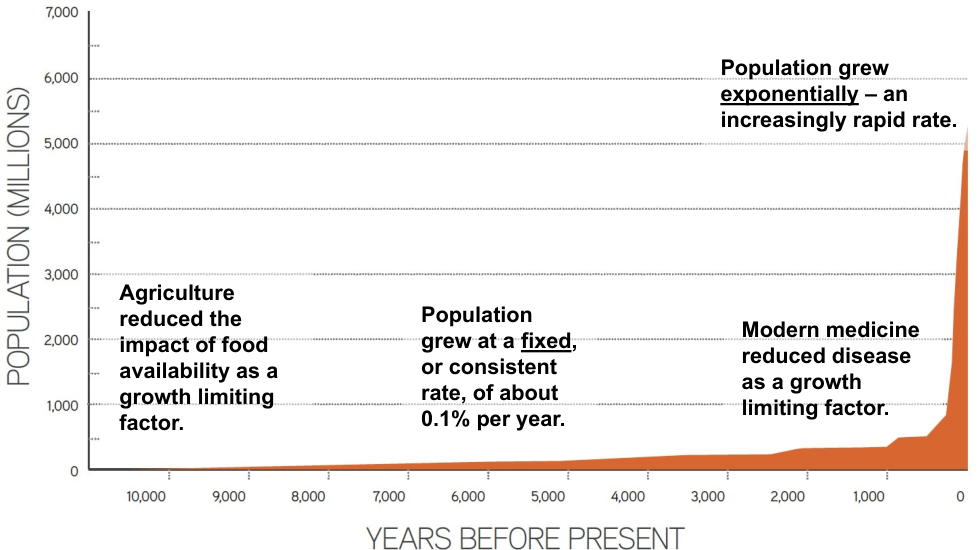
What was a major benefit of the agricultural shift?
What do vaccines contain?
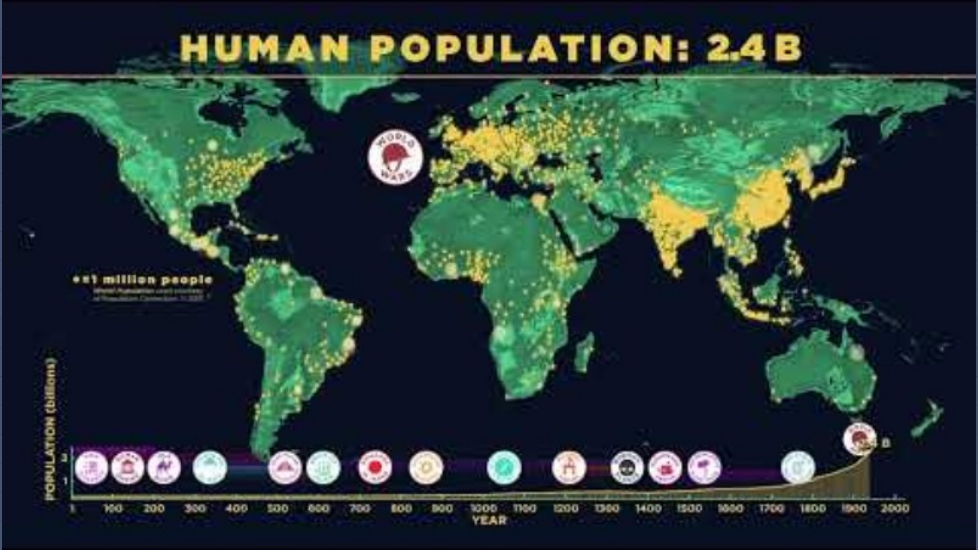
What best describes the population growth trend observed?
How did modern medicine influence population dynamics?
What was a major limitation for population early on?
What does total fertility rate represent?
What happens at replacement level fertility?
Which region typically has high fertility rates?
What is a negative aspect not reflected in GDP per capita?
Which factor is considered a positive indicator of quality of life?
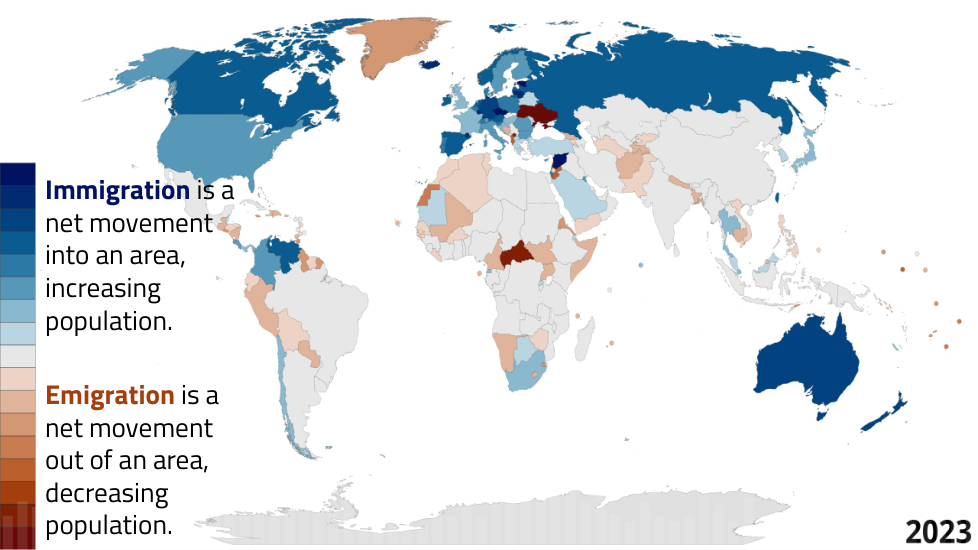
What does light color represent on this immigration map?
What is emigration?
If a country has high immigration, what happens?
Which age group has the widest bars reflecting higher fertility rates?
What does a population pyramid primarily illustrate?
In population pyramids, what do the blue bars represent for males?
Which population shape indicates rapid growth?
What indicates a country with declining population?
In which shape are elderly populations more common?
In which stage is the birth rate the highest?
What is the trend of the birth rate in the postindustrial stage?
During the demographic transition, which rate typically decreases first?
Why are birth rates high in the preindustrial stage?
What causes high death rates in the preindustrial stage?
Which statement is true regarding present-day countries?
Why do birth rates remain high in the early transition stage?
What is the expected population trend during the early transition?
What factors contribute to decreasing death rates?
What does a narrow top in a population pyramid often suggest?
What is indicated by an early transition in a population pyramid?
What might a large population in younger age groups indicate?
What social factor contributes to declining birth rates?
How does the population growth rate change in the late transition?
Which factor is related to women's roles in family planning?
Which decade saw the lowest birth rate in the graph?
What factor contributed to declining fertility rates?
What trend is observed from 1950 to 2000?
What does a stabilizing base indicate about fertility rates?
In population pyramids, what do different colors usually represent?
What key demographic feature can shifting fertility rates affect?
What does population momentum refer to?
What occurs after birth and death rates stabilize?
How do death rates react during the industrial stage?
In the pyramid, what does the width indicate?
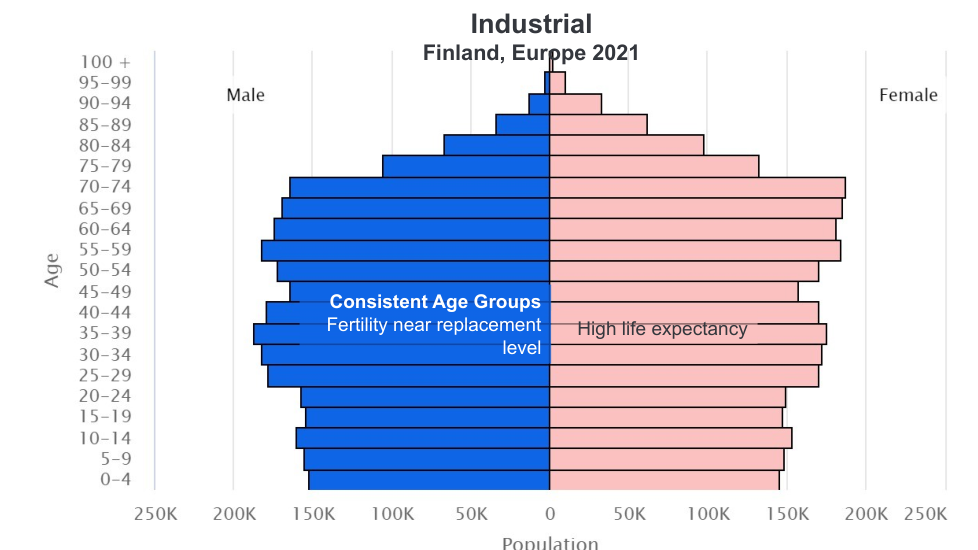
What is indicated by a high life expectancy?
What does the 'fertility near replacement level' mean?
What is a contributing factor to falling birth rates?
What trend typically follows the decline in birth rates?
What does a high number of working parents affect?
What does the post-industrial stage signify about a country's economy?
In population studies, what represents the age group most affected by low fertility?
Why are population pyramids important for understanding demographics?
In which stage does the birth rate fall below replacement?
What happens to population growth in Stage 3?
Which stage shows stable or slow growth?
What is one consequence of son preference?
Which system may influence son preference?
How can inheritance laws affect family preferences?
What policy was introduced in China in 2015?
Why did China change to a three-child policy in 2021?
What issue did the policies aim to alleviate in China?
What preference is indicated in the population data?
Approximately how many more males are in population in 2021?
What does the population pyramid illustrate?
What is the expected world population around 2100?
Which scenario shows lower future population growth?
The median projection line suggests what about population growth?