Megan created the histogram shown to display the ages of the residents in her apartment building.
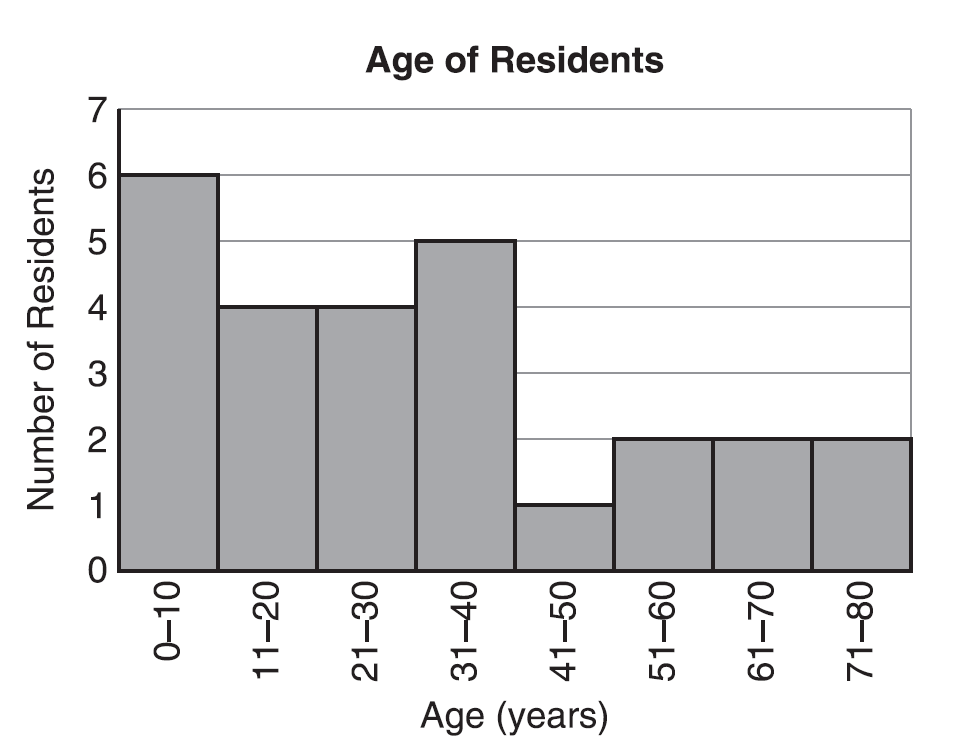
Based on the information in the histogram, which statement must be true?
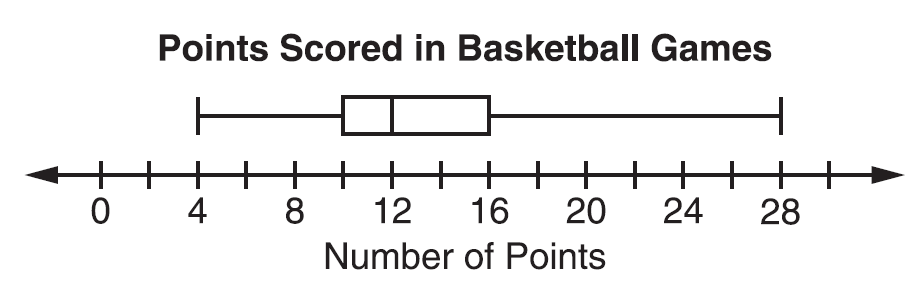
The box plot shows the distribution of the number of points Monica scored in each of her basketball games during the season.

Which statement is true about the number of points Monica scored during the season?
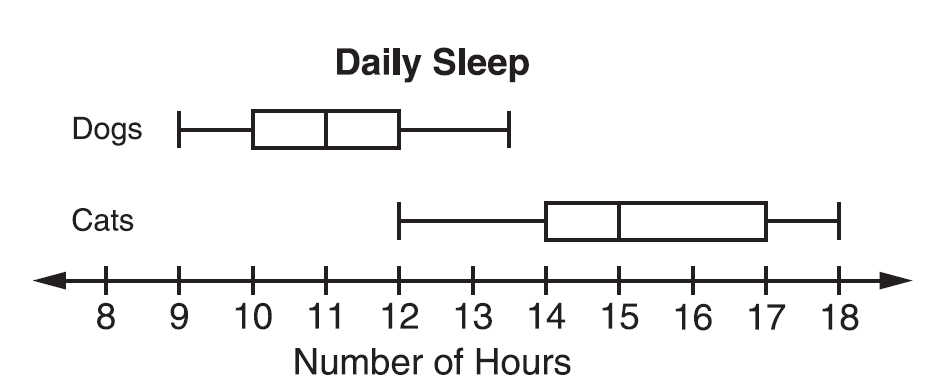
The box plots shown represent the numbers of hours of daily sleep for a group of dogs and a group of cats.

Which statement about the daily sleep habits of the groups of dogs and cats is true?
Rachel recorded the wait times, in minutes, of 10 consecutive customers at two different restaurants. The data are shown in the table.
Which conclusion is best supported by the data?
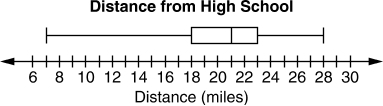
The box plot shows the distribution of the distances, in miles, the students live from a high school.

What is the interquartile range of this data set?
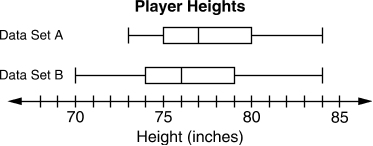
A coach recorded the heights, in inches, of the players on the basketball team during two seasons. Data Set A shows the heights during the first season and Data Set B shows the heights during the second season.

Write the phrases in the boxes to complete the statements comparing the data sets.
The range of Data Set A is the range of Data Set B.
The interquartile range of Data Set A is the interquartile range of Data Set B.
greater than
equal to
less than