Beak Size Variation in Galápagos Finches
On the Galápagos Islands, a group of birds known as Darwin’s finches became a classic example of natural selection in action. Although these finches share a common ancestor, their beaks vary widely in shape and size. Each species’ beak is adapted to the type of food it eats - some have strong, thick beaks for cracking hard seeds, while others have thin, pointed beaks for catching insects or sipping nectar.
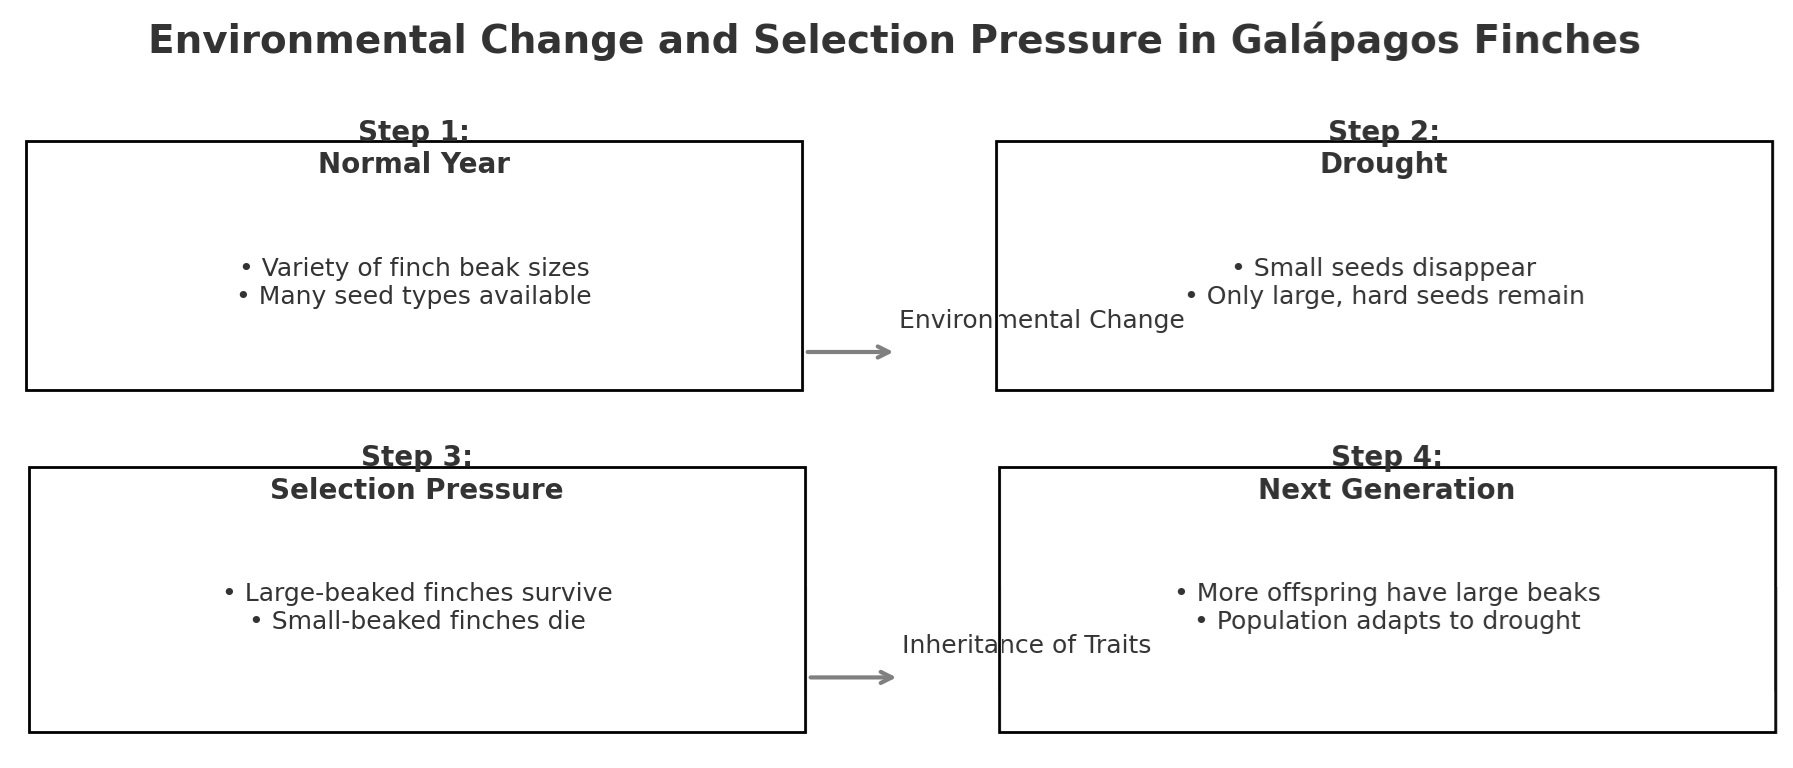
In the 1970s, scientists Peter and Rosemary Grant began studying a population of medium ground finches (Geospiza fortis) on Daphne Major, one of the smaller Galápagos Islands. They measured every bird’s beak and tracked survival over time. During years when food was plentiful, finches with different beak sizes survived equally well. However, in 1977, a severe drought hit the island. The smaller, softer seeds became scarce, leaving mostly large, hard seeds.
Finches with larger, stronger beaks were able to crack these tough seeds and survive. Many small-beaked finches died before reproducing. As a result, the next generation had a higher proportion of birds with larger beaks. When rains returned years later, smaller seeds became common again, and smaller-beaked birds had an advantage once more.
The Grants’ decades of research showed that natural selection can act quickly when environmental conditions change. Beak size isn’t “chosen” by the birds—it’s a heritable trait that influences which individuals are more likely to survive and reproduce. Over time, such selection pressures can even lead to the formation of new species.
This example demonstrates how genetic variation within a population gives certain individuals a better chance to survive when the environment changes, leading to shifts in the population’s traits over generations.
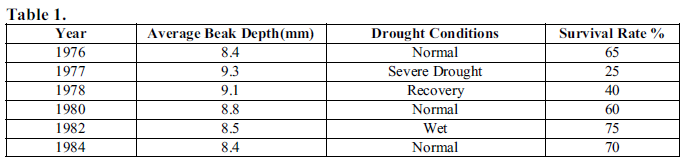
Graph of Information - Figure 1.
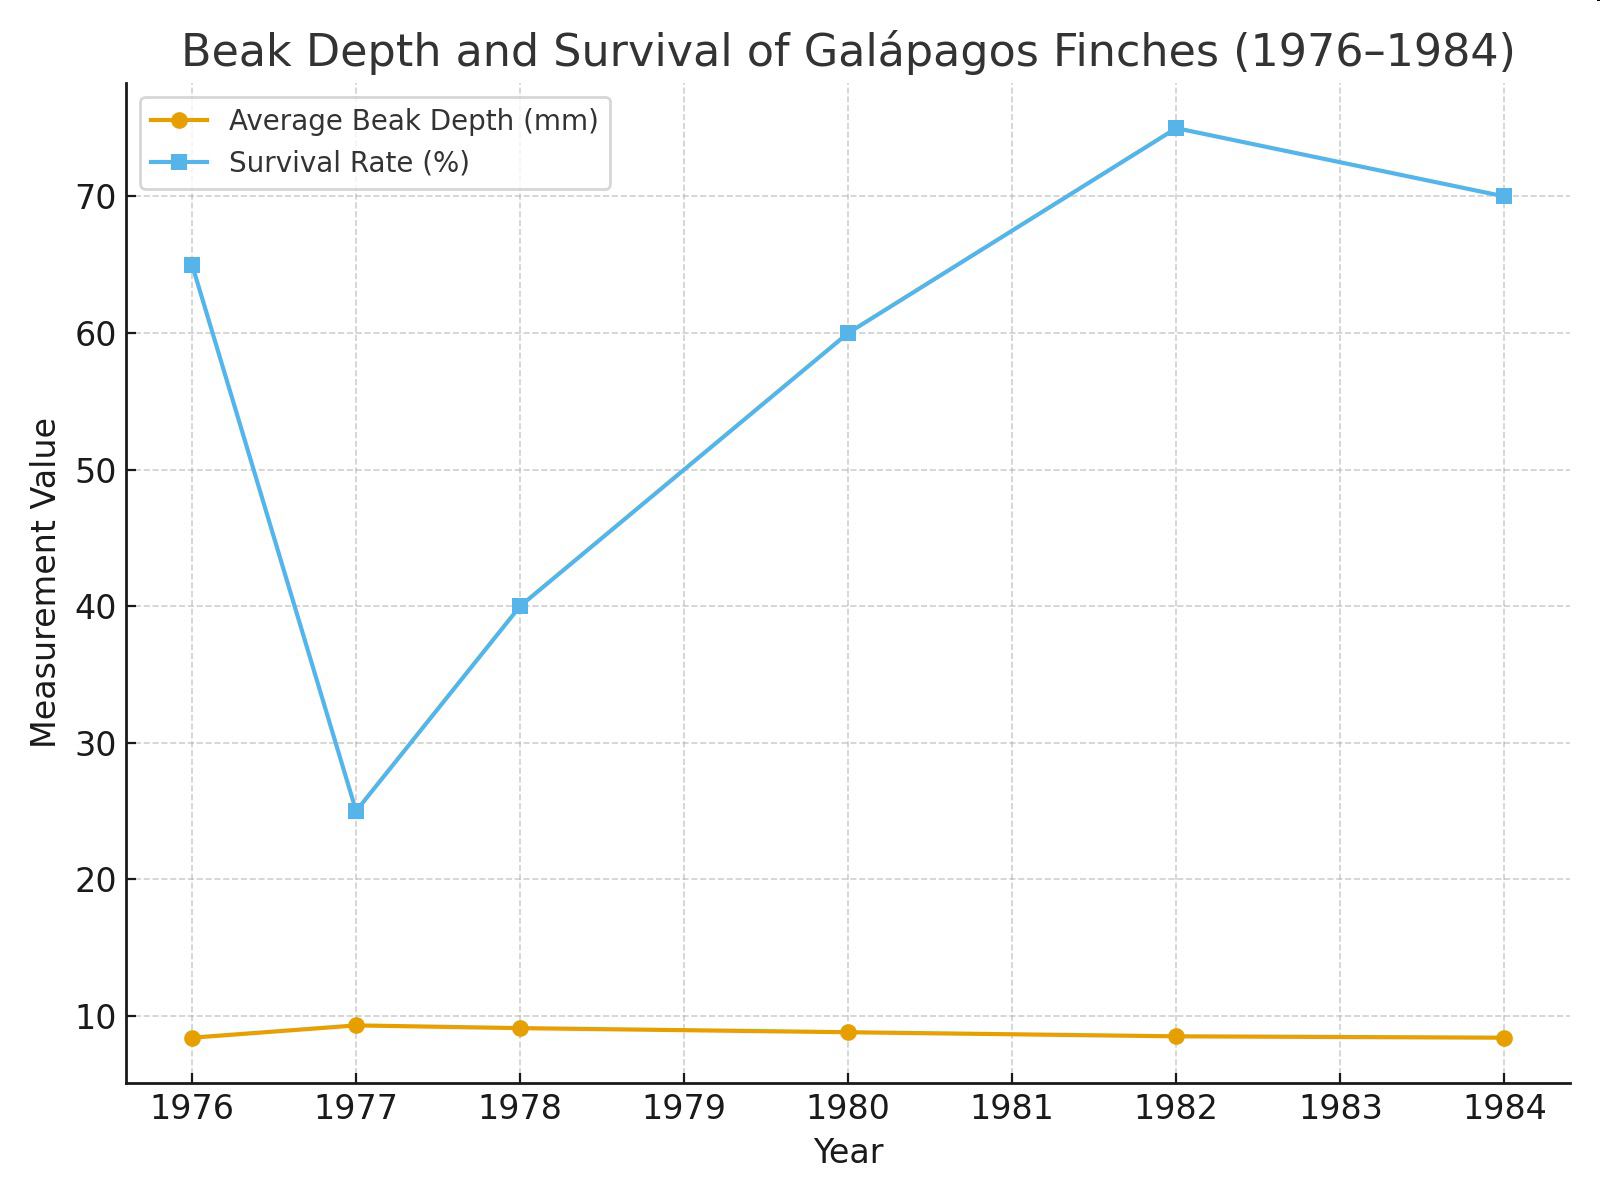
Figure 2.
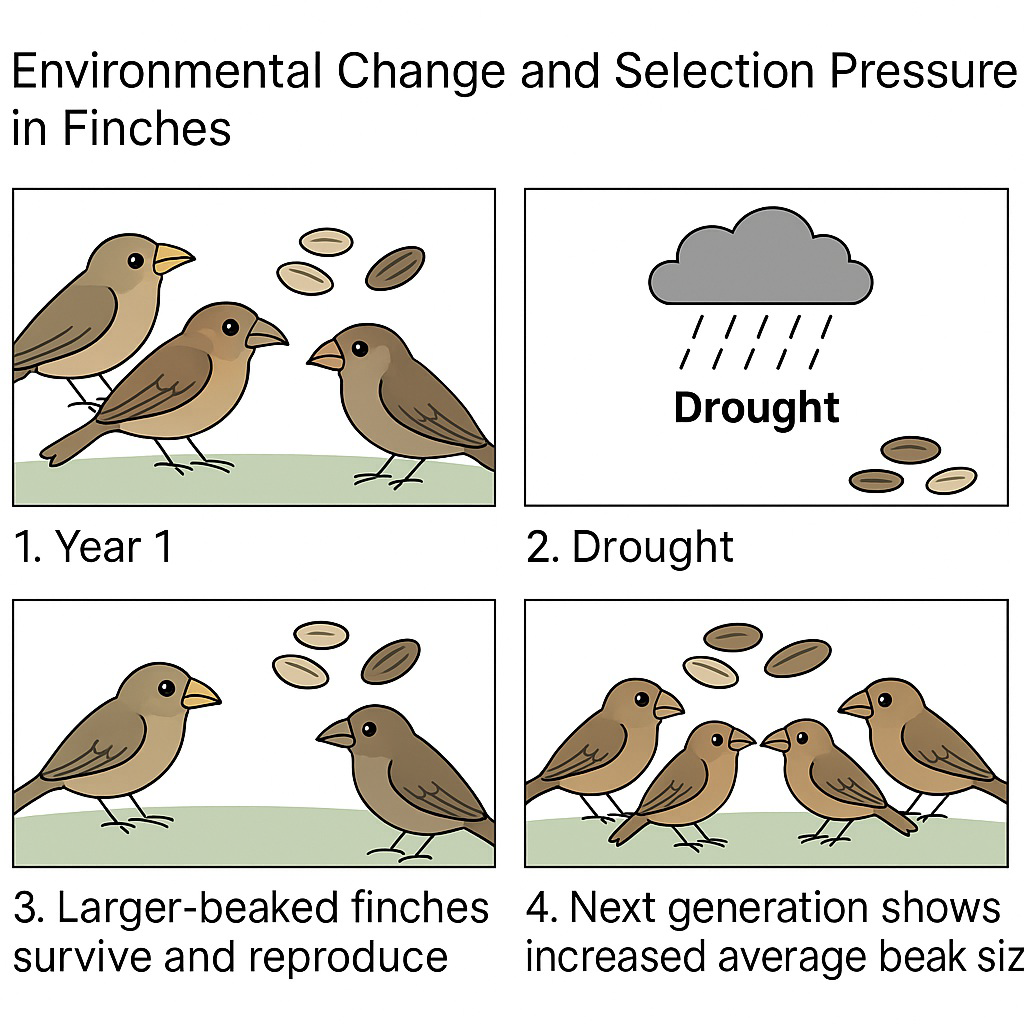
Figure 3.