Our Earth is an interconnected system. When one part changes, it can trigger changes in others.
We can group these parts into:
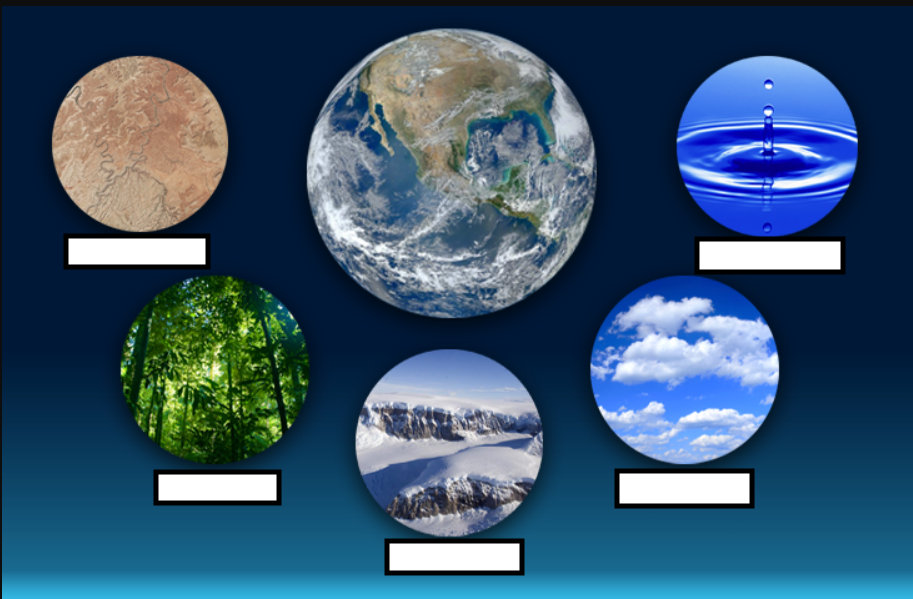
Atmosphere: The layer of gases surrounding Earth that regulates temperature, protects life from harmful radiation, and drives weather and climate.
Hydrosphere: All liquid water on Earth — oceans, rivers, lakes, groundwater, and precipitation — which circulates through the other spheres and supports life.
Biosphere: All living organisms and the ecosystems they form, interacting with other spheres to cycle energy and matter.
Cryosphere: The frozen parts of Earth — glaciers, ice caps, sea ice, and permafrost — which influence sea level, albedo, and climate patterns.
Geosphere: The solid Earth — rocks, minerals, mountains, and the planet’s interior — that shapes landscapes and provides the foundation for soils and landforms.
Drag each label to the image that best represents that sphere.
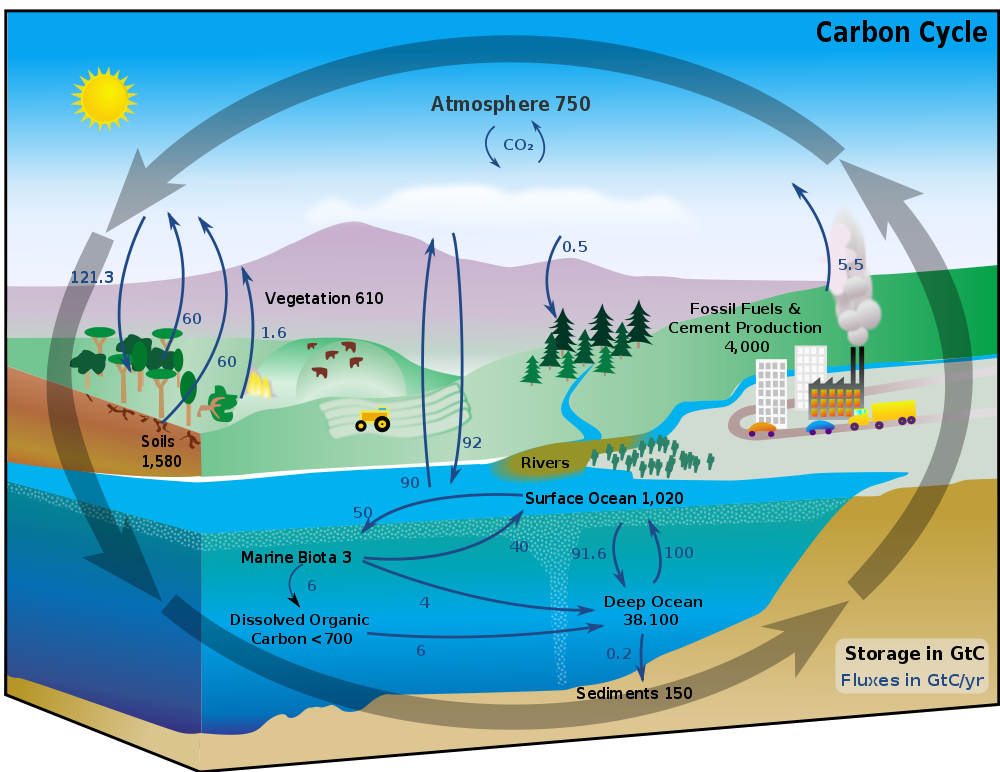 Carbon exists in every Earth sphere: in rocks and soils (geosphere), dissolved and flowing in water (hydrosphere), as gases like CO2 (atmosphere), frozen in ice and permafrost (cryosphere), and inside living organisms (biosphere). Processes such as photosynthesis, respiration, weathering, and melting move carbon between these reservoirs.