7.3 Exit Ticket: Venn Diagrams Part 2
star
star
star
star
star
Last updated 20 days ago
6 Nsɛmmisa
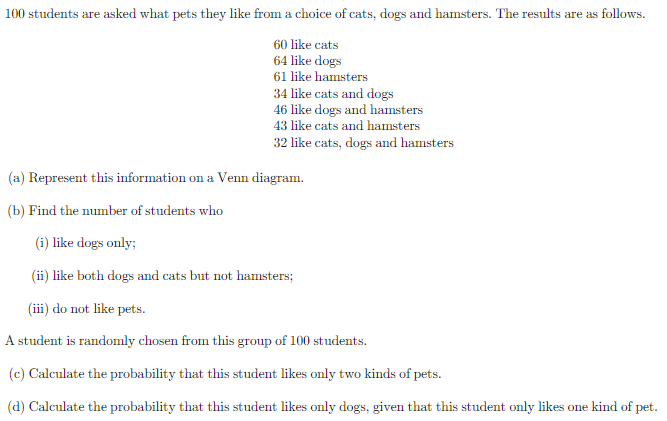
Represent this information with a Venn Diagram
Find the number of students who like dogs only
Find the number of students who like both dogs and cats but not hamsters
Find the number of students who do not like pets
A student is randomly chosen from this group of 100 students. Calculate the probability that this student likes only two kinds of pets.
A student is randomly chosen from this group of 100 students. Calculate the probability that this student likes only dogs given that they only like one kind of pet.