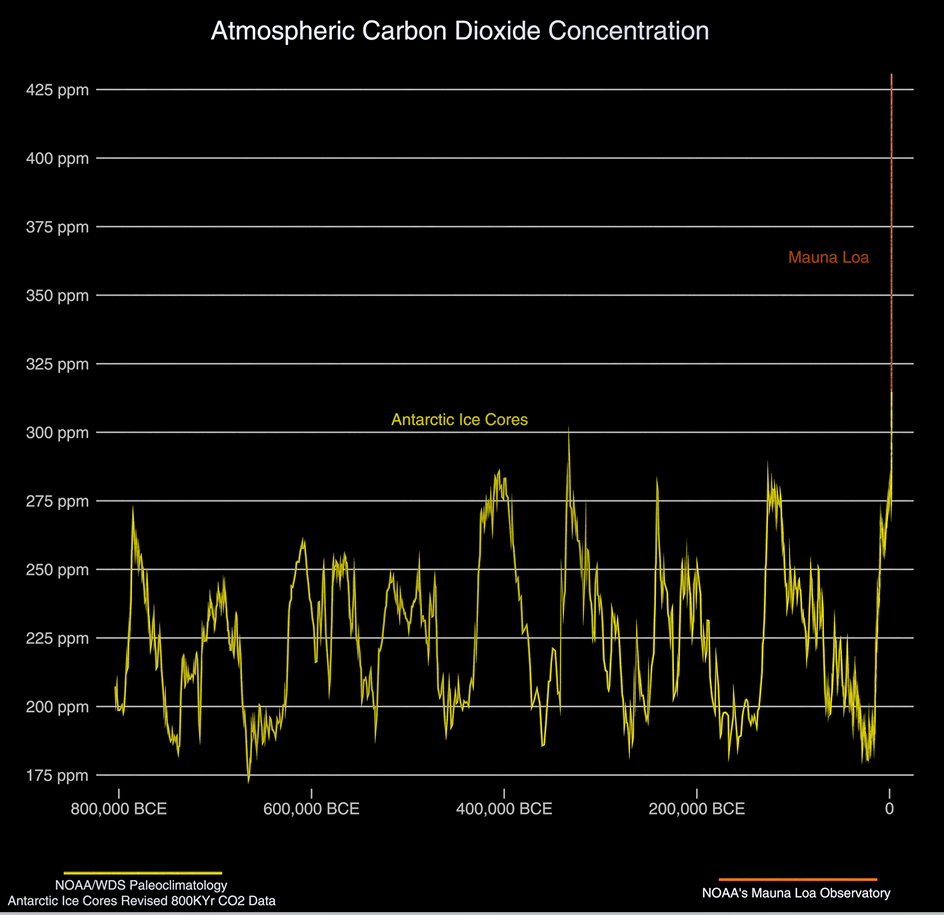
What do Antarctic ice cores show about CO2 over the last ~800,000 years?
What do Antarctic ice cores show about CO2 over the last ~800,000 years?
Match each term to its description.
| Draggable item | arrow_right_alt | Corresponding Item |
|---|---|---|
Negative (Balancing) Feedback Loop | arrow_right_alt | When things affect each other in a circle |
Feedback Loop | arrow_right_alt | If one part goes up, it causes another part to go up |
Positive (Reinforcing) Feedback Loop | arrow_right_alt | If one part goes up, the loop causes changes that bring it back down |
Where is carbon found?
Plants remove carbon from the atmopshere using .
Animals and plants release carbon into the atmosphere through .
What do Antarctic ice cores show about CO2 over the last ~800,000 years?
What do modern observations at the Mauna Loa Observatory show about CO2 concentrations in more recent history?
Fossil fuels release carbon into the atmosphere through .
Deforestation of the Amazon has become a of carbon because burning trees carbon faster than photosynthesis it.
Urban heat spots happen when cities get hotter than nearby countryside. Dark roads, roofs, and buildings soak up sunlight and hold heat. With fewer trees and plants, there is less cooling from shade and water evaporating. When temperatures rise, people use their air conditioners (AC) to cool down. These air conditioners are powered by electricity generated from the burning of fossil fuels.
Complete the box model to represent the effect of rising urban temperatures on atmospheric CO2.
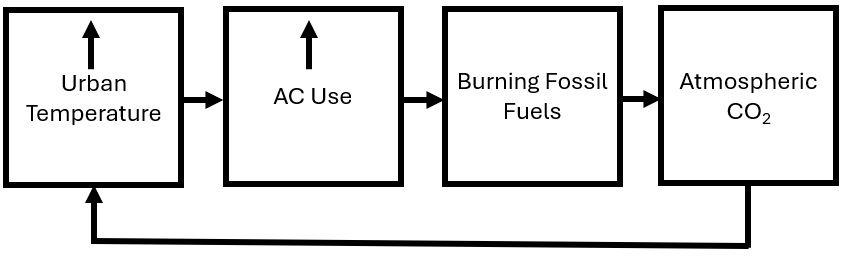


Urban heat spots (from the previous question) are an example of a feedback loop because and the loops is .
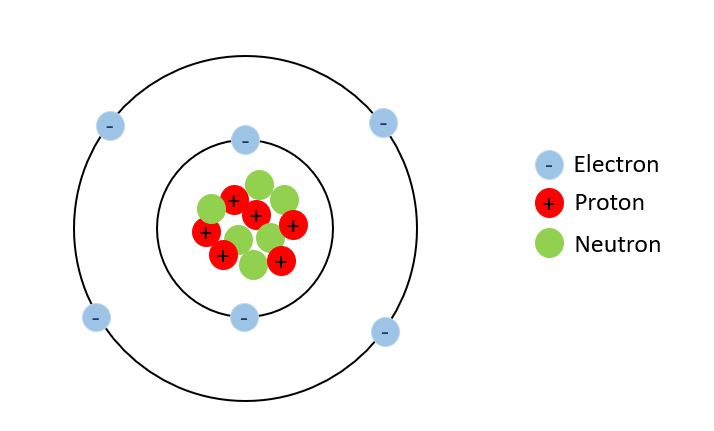 Why does carbon play an essential role in living and non-living things?
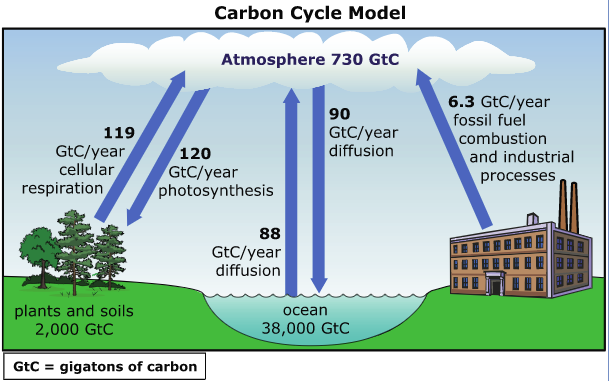
The simplified Carbon Cycle Model shows locations where carbon is stored and processes that move carbon from one location to another.
Use this Carbon Cycle Model to identify all the processes that would decrease CO2 in the atmosphere if the rates of these processes were to increase.
Match the carbon reservoirs to their sphere.
| Draggable item | arrow_right_alt | Corresponding Item |
|---|---|---|
Hydrosphere | arrow_right_alt | Soil, rocks, ocean sediment, fossil fuels |
Cryosphere | arrow_right_alt | Marine animals, plants, algae, shells, coral, sediments |
Geosphere | arrow_right_alt | Land plants & animals |
Biosphere | arrow_right_alt | Gases surrounding the Earth's surface |
Atmosphere | arrow_right_alt | Solid ice, glaciers, permafrost |
Consider this box model where the arrows represent the amount of carbon flowing through a reservoir.
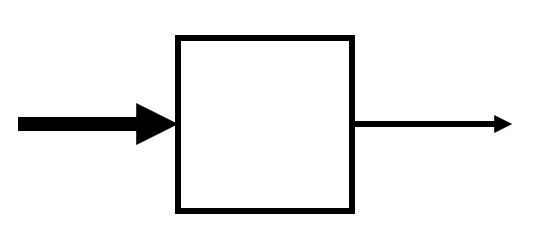
Describe the flow of carbon:
What will happen to the amount of carbon in the reservoir?
This is an example of a carbon
Consider this box model where the arrows represent the amount of carbon flowing through a reservoir.
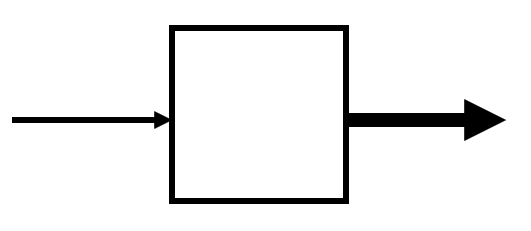
Describe the flow of carbon:
What will happen to the amount of carbon in the reservoir?
This is an example of a carbon
If the law of conservation of mass says matter cannot be created or destroyed, what is the source of the increased carbon in the atmosphere?
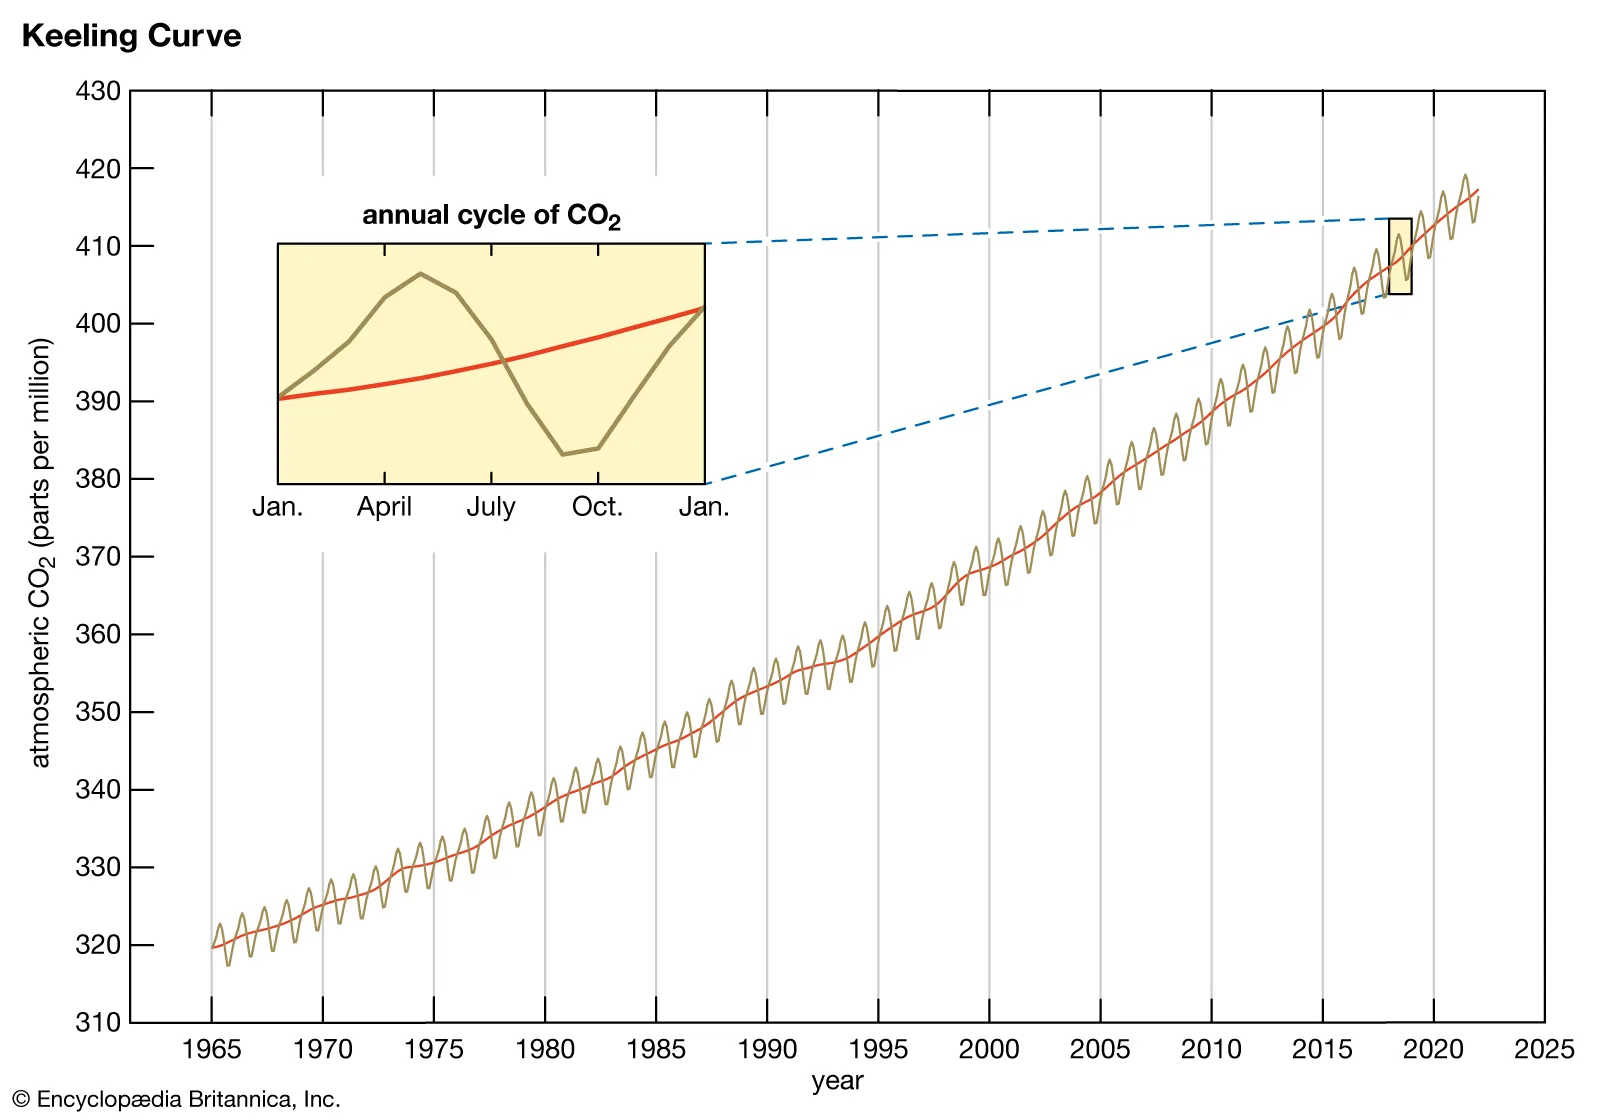 While the amount of carbon dioxide in the atmosphere has increased overall since 1965, scientists have noticed a pattern of year increases and decreases. What explains this pattern?
In spring and summer plants grow and more CO₂ through photosynthesis, so atmospheric CO₂ .
In fall and winter plants stop growing and decomposition and respiration CO₂, so levels .
This is a diagram of the carbon cycle.
Select the processes that add CO2 to the atmosphere.
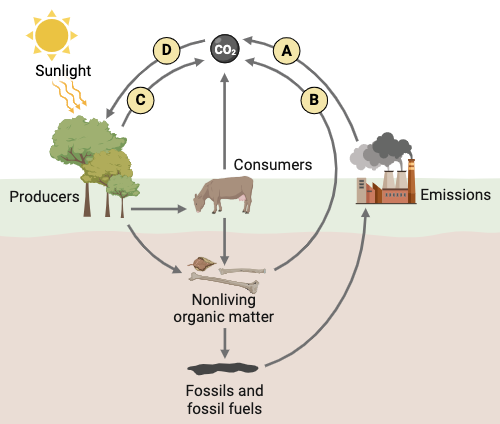
Which of the following is responsible for CO2 in the atmopshere?
What parts of this unit did you enjoy?
What parts of this unit could Mrs. Winer improve?