DIRECTIONS: There are several passages in this test. Each passage is followed by several questions. After reading a passage, choose the best answer to each question and fill in the corresponding oval on your answer document. You may refer to the passages as often as necessary.
You are not permitted to use a calculator on this test.
DIRECTIONS: There are several passages in this test. Each passage is followed by several questions. After reading a passage, choose the best answer to each question and fill in the corresponding oval on your answer document. You may refer to the passages as often as necessary.
You are not permitted to use a calculator on this test.
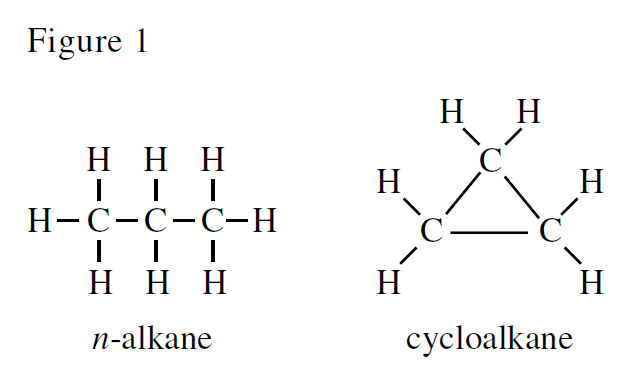
Alkanes are chemical compounds consisting of only carbon and hydrogen atoms. Two types of alkanes are
-alkanes (molecules in which the carbon atoms are bonded together to form a chain) and cycloalkanes (molecules in which the carbon atoms are bonded together to form a ring). Figure 1 shows an example of an -alkane and an example of a cycloalkane.
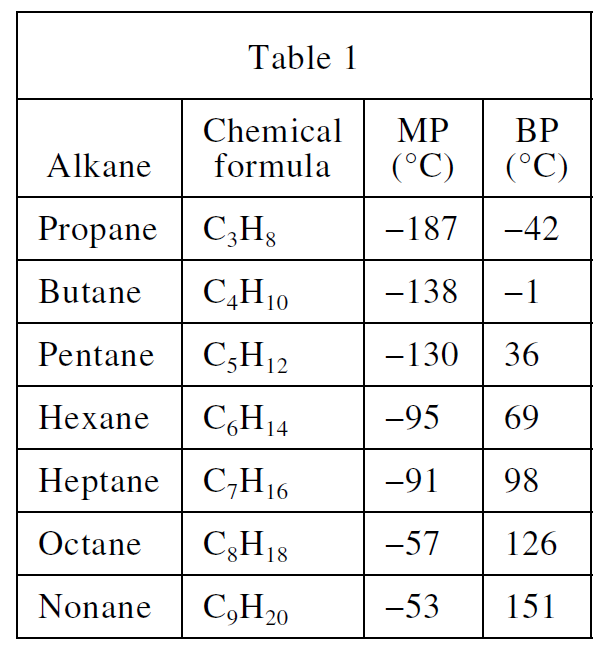
Table 1 shows, for each of 7
-alkanes, the name, chemical formula, melting point (MP) at 1 atmosphere (atm) of pressure, and boiling point (BP) at 1 atm.
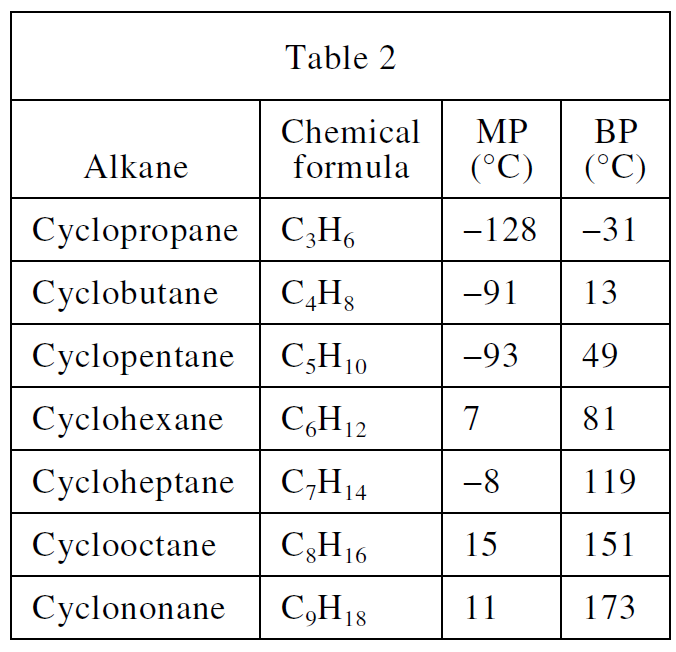
Table 2 shows, for each of 7 cycloalkanes, the name, chemical formula, MP at 1 atm, and BP at 1 atm.
Star formation begins with the gravitational collapse of matter in an interstellar gas cloud. A protostar (forming star) affects gas in the surrounding portions of the cloud in 2 ways:
The protostar’s gravitational field attracts gas, causing the gas to accrete (accumulate onto the protostar).
Radiation pressure (RP) associated with the protostar’s emissions causes gas to be pushed away from the protostar, inhibiting accretion.
Star formation ends when the effect of RP overcomes that of gravity. At that point, the protostar can no longer gain mass by accretion and is considered a fully formed star.
Three scientists debate whether the maximum mass that a protostar can reach by accretion is great enough to account for the most massive stars observed.
Scientist 1
The effect of RP is uniform in all directions around a protostar. As a result, the maximum mass that a protostar can reach by accretion is
Scientist 2
Scientist 1 is correct that stellar mergers are likely. However, because a protostar rotates about its axis, a disk of gas forms in the plane of the protostar’s equator. This reduces the effect of RP in that plane, allowing gas from the disk to readily accrete. As a result, the maximum mass that a protostar can reach by accretion is
Scientist 3
Stellar mergers are very unlikely given the vast distances between stars, even within clusters. Scientist 2 is correct about the formation and the effect of the disk. In addition, a protostar produces bubble-like regions of radiation that increase the effect of RP near the protostar’s poles, promoting the flow of gas into the disk. As a result, accretion continues until the surrounding portions of the cloud are nearly depleted of gas. Therefore, the maximum mass that a protostar can reach by accretion is limited only by the amount of available gas.
Dyes such as Congo red are often found in industrial wastewater and must be removed before the water can be discharged. Scientists performed 3 experiments to determine how much Congo red would be removed from a solution by binding to particles of bentonite (B), which is a type of clay, or to particles of a chemically modified bentonite (MB).
In each trial of each experiment, Steps 1–5 were performed:
A 50 mL volume of an aqueous 300 mg/L Congo red solution having a particular pH was placed in each of 2 flasks. A specific mass of B was added to one flask, and the same mass of MB was added to the other flask.
The flasks were sealed and shaken at a speed of 200 revolutions per minute for a certain length of time at 25°C.
The contents of each flask were filtered to remove all solid material.
The concentration of Congo red remaining in the solution from each flask was measured.
The percent of Congo red that had been removed (% CR removed) from the solution was calculated for each flask.
Experiment 1
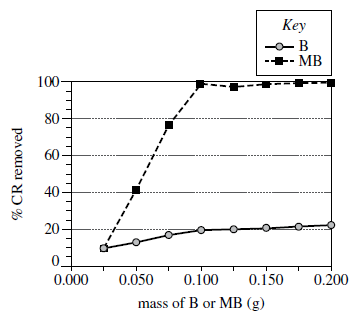
In all trials, the pH of the Congo red solution was the same, and the shaking time was 360 min. From trial to trial, the mass of B and of MB was varied. The results are shown in Figure 1.
Figure 1

Experiment 2
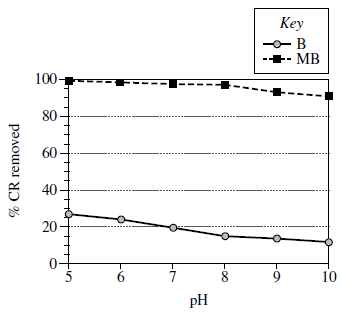
In all trials, the mass of B and of MB was 0.100 g, and the shaking time was 360 min. From trial to trial, the pH of the Congo red solution was varied. The results are shown in Figure 2.
Figure 2

Experiment 3
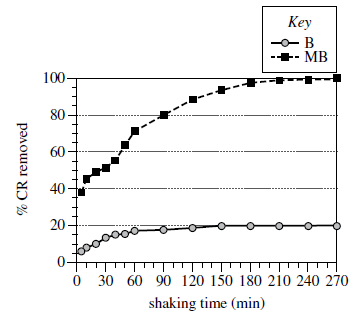
In all trials, the pH of the Congo red solution was the same as it was in Experiment 1, and the mass of B and of MB was 0.100 g. From trial to trial, the shaking time was varied. The results are shown in Figure 3.

Antioxidants are substances that can protect against cellular damage. Over time, antioxidants break down. Antioxidants break down faster when exposed to light or added heat. Blackberries are a good source of antioxidants such as total monomeric anthocyanins (TMA).
Scientists conducted an experiment to study how different types and concentrations of pectin (a substance used in jam production) affect the breakdown of TMA in blackberry jam during 6 months of storage.
Experiment
The scientists obtained fresh blackberries and determined that the concentration of TMA was 200 mg TMA per 100 g of blackberries. The scientists then made 9 batches of blackberry jam. Each batch used 1 of 3 types of pectin (Pectin X, Y, or Z) at 1 of 3 concentrations (0.3%, 0.7%, or 1.0% by mass). For each batch, 6 identical transparent jars were obtained. Each batch was equally portioned into its 6 jars, which were then capped and submerged in boiling water for 10 min. All jars were then placed in a dark storage area maintained at
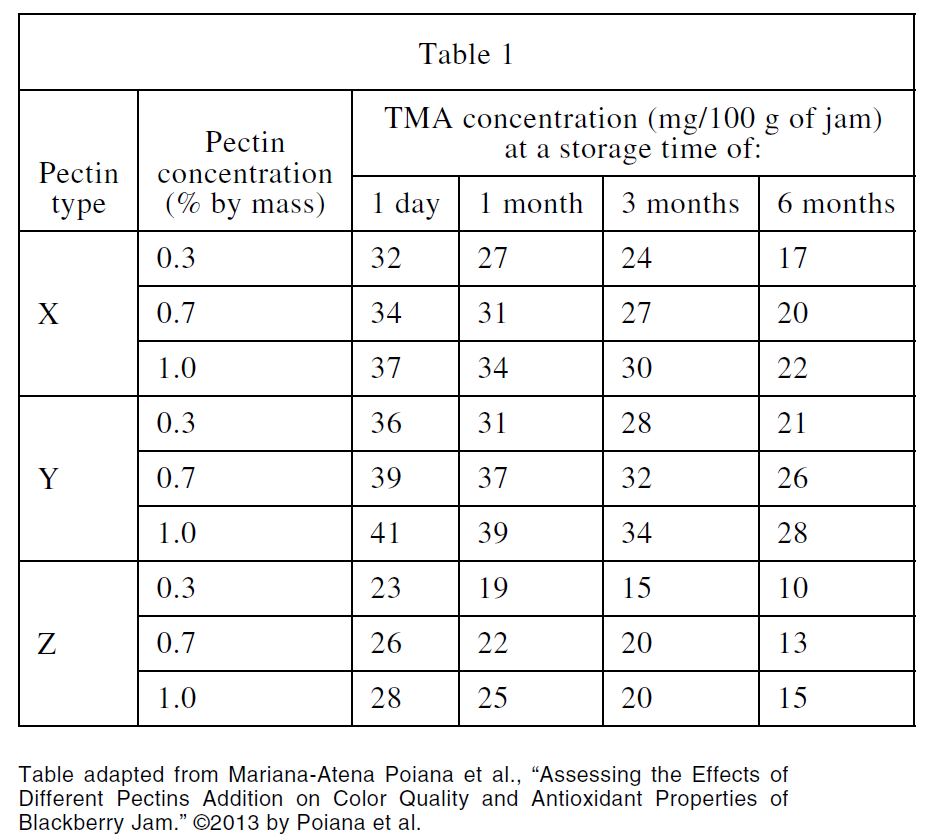
Jars from each batch were selected after storage times of 1 day, 1 month, 3 months, and 6 months. Once selected, a jar was removed from storage, and its contents were analyzed for TMA concentration before being discarded. The results are shown in Table 1.

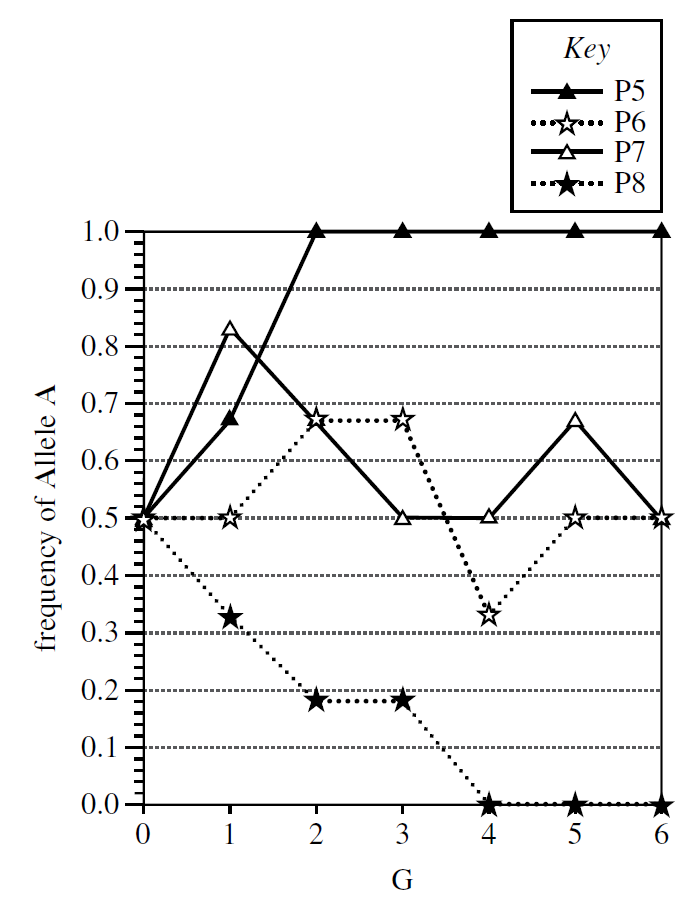
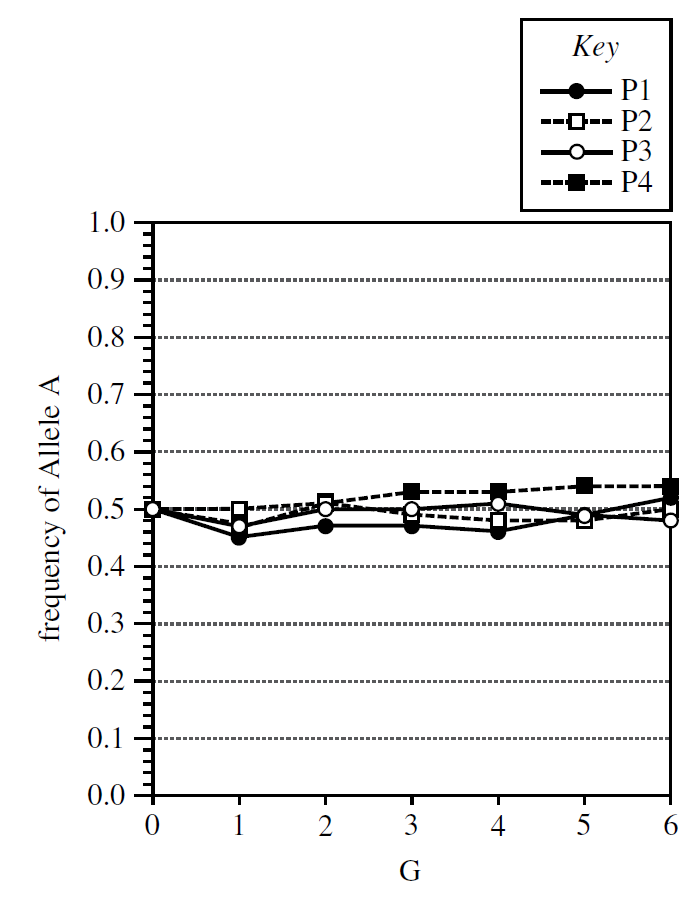
A computer simulation was run to study genetic drift (random fluctuations in allele frequencies) over several generations of 8 populations (P1–P8) of amoebas that reproduce asexually. Each amoeba in the initial generation (G0) of each population was homozygous for 1 of the alleles, Allele A or Allele B, of a specific gene. Each of 6 subsequent generations (G1–G6) was produced by randomly choosing half of the amoebas from the previous generation to reproduce. Figure 1 shows the frequency of Allele A in G0–G6 for each of P1–P4; Figure 2 shows the same for each of P5–P8. There were 10,000 amoebas in G0 of each of P1–P4; there were 12 amoebas in G0 of each of P5–P8.
Figure 1

Figure 2

Figures adapted from Teresa Audesirk et al., Biology: Life on Earth, 6th ed.
2002 by Prentice-Hall, Inc.
According to Table 2, at 1 atm, what is the BP of the alkane with the chemical formula
For the
-alkanes listed in Table 1, as the number of carbon atoms per molecule increases, the BP at 1 atm:At 1 atm, how many of the cycloalkanes listed in Table 2 have an MP above the MP of ice?
Based on Tables 1 and 2, what is the name of the
Based on Table 2, in a molecule of any given cycloalkane, the number of hydrogen atoms is always equal to:
Relative to the center of the protostar, does gravity more likely accelerate gas particles inward or outward, and does RP more likely accelerate gas particles inward or outward?
Based on Scientist 2’s argument, do gas particles more likely accrete near the equator or near the poles of a protostar with a disk?
One of the most massive stars known is Eta Carinae, which has an approximate mass of
When the effect of RP overcomes that of gravity, a star is said to have “emerged from its envelope,” because that is the first time the star is directly observable from outside the cloud. An observation of which of the following stars emerging from its envelope would support Scientist 2’s argument but weaken Scientist 1’s argument?
Scientists 2 and 3 agree that a disk forms around a protostar as a result of the protostar’s:
Which of the scientists, if any, would be likely to agree that the Sun could have formed entirely by accretion?
Scientists conducted a study to examine how sunlight intensity (the percent of maximum possible sunlight) affects seedling growth and survival.
Study
Seeds were collected from a certain species of plant growing in a temperate grassland. The seeds were planted and grown in identical conditions for 2 months. Then 800 similar-sized seedlings were selected, and each was transplanted into its own pot. All the pots were identical and contained the same amount of a particular soil. The pots were equally divided into 4 groups (Groups 1–4), and then all the groups of pots were placed next to each other in the temperate grassland. In 3 of the groups, all the pots in a group were covered by the same number of layers of a plastic mesh to reduce sunlight intensity. The number of layers was different for each of those 3 groups.
Group | Sunlight intensity |
|---|---|
1 | 10% |
2 | 25% |
3 | 50% |
4 | 100% |
The seedlings were then grown for the next 10 weeks, during which all the pots were watered daily with the same amount of water.
At 10 weeks, the surviving plants were harvested, and the average dry mass of the plants in each group was determined. The seedlings that did not survive were counted, and the seedling mortality (the percent of seedlings that did not survive to 10 weeks) was also determined for each group. The results are shown in Table 2.
Group | Average dry mass (g) | Seedling mortality (%) |
|---|---|---|
1 | 0.18 | 8 |
2 | 0.58 | 3 |
3 | 0.80 | 2 |
4 | 0.57 | 6 |
Table adapted from Marina Semchenko et al., “Positive Effect of Shade on Plant Growth: Amelioration of Stress or Active Regulation of Growth Rate?”
2011 by British Ecological Society.
Which of the following pie charts best represents the seedling mortality results for Group 4?
The pots in which group were most likely covered by the greatest number of layers of the plastic mesh?
Based on the results of the study, approximately what percent of the seedlings that received a sunlight intensity of 10% survived to 10 weeks?
Suppose that as the plant dry mass increases, the leaf area ratio (a measure of the leaf area per gram of plant mass) decreases. Based on the results of the study, the plants in which group most likely had the lowest leaf area ratio?
The effect of what abiotic factor was examined in the study?
Based on the results of the study, what was the dry mass of an individual seedling in Group 2?
In each trial, the flasks were most likely shaken to:
Suppose that, in an additional trial of Experiment 3, a shaking time of 100 min had been tested. The % CR removed by MB in this trial would most likely have been between:
In Experiment 2, the % CR removed by B from the neutral Congo red solution was closest to which of the following?
Based on the results of Experiments 2 and 3, the % CR removed would likely be greatest for which of the following combinations of pH and shaking time?
Based on Figure 2 and additional information in the passage, how many trials were performed in Experiment 2?
Consider the description of Experiment 1 and the % CR removed by MB in the 0.200 g trial of Experiment 1. The concentration of Congo red that remained in the solution when the shaking ended was approximately:
Introduction
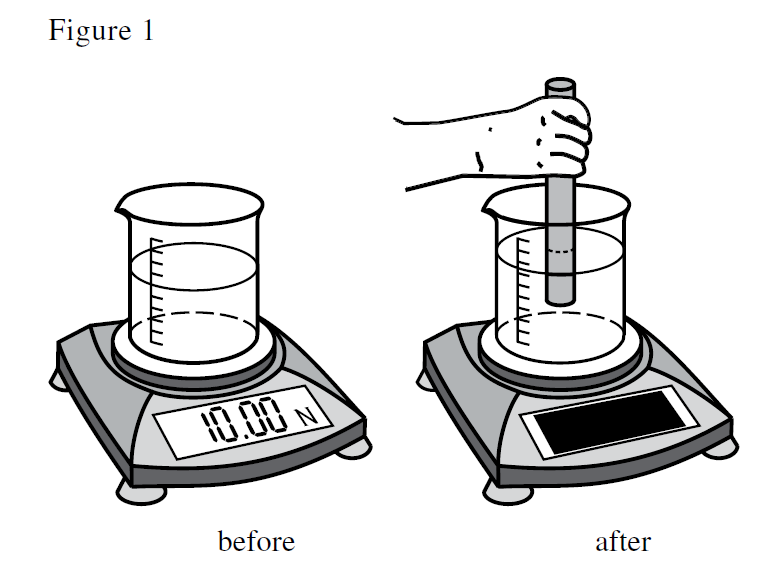
A teacher performed a demonstration on forces. She placed a beaker on a digital scale and added water until the combined weight (the force of gravity on an object) of the beaker and water was
Figure 1

The teacher then asked her students, “The rod has a weight of
Student 1
The rod displaces some water, producing 2 simultaneous effects:
An upward buoyant force,
The depth of the water increases, which causes the water pressure at the bottom of the beaker to increase. As a result, a downward force—equal in magnitude to
Therefore, the teacher’s hand is supporting a weight equal to
Student 2
Student 1 is correct that
Student 3
Student 1 is correct that
Student 4
Student 1 is correct that water depth increases. However, the rod is denser than water, so
Which student would be most likely to agree that while the rod was partially submerged, the scale was supporting the entire weight of the rod?
Within a fluid, pressure increases as depth increases. This fact weakens the response(s) given by which student(s)?
Suppose that it were determined that the magnitude of
Suppose that the teacher had held the rod above the water such that no portion of the rod was ever submerged. Based on Student 1’s response, how much weight would the teacher’s hand have been supporting,
In regard to
Consider the “before” portion of Figure 1, and assume that the scale was on a lab bench. If the scale itself had a weight of
For the batch of jam prepared with 1.0% Pectin Z by mass, as storage time increased, the TMA concentration:
Suppose the scientists had also prepared a batch of jam using 0.5% Pectin Y. Based on the results of the experiment, at a storage time of 3 months, the TMA concentration would most likely have been between:
Which of the following variables was not an independent variable in the experiment?
Suppose that the experiment had been repeated, except that the jars had been stored at 30°C. Would the TMA concentrations in this new experiment more likely have been less than or greater than the corresponding TMA concentrations listed in Table 1? The TMA concentrations in the new experiment would most likely have been:
Assume that, in the recipe the scientists used, 100 g of jam was produced for every 70 g of blackberries. If no TMA broke down as the jam was prepared, what mass of TMA would have been found in 100 g of jam before the jars were placed in boiling water?
A total of how many jars were prepared in the experiment?
Allele A and Allele B can best be described as:
Suppose that another population of amoebas with an initial Allele A frequency of 0.5 and an initial size of 10,000 had been included in the computer simulation. Based on Figure 1, the frequency of Allele B in G2 for that population would most likely have been closest to which of the following?
According to Figure 2, Allele B was absent from which of P5–P8 in G2?
Based on Figures 1 and 2, is the effect of genetic drift on allele frequency greater in a relatively large population or in a relatively small population?
Based on Figure 1, in the initial generation of each of P1–P4, how many amoebas had the genotype AA, and how many amoebas had the genotype BB?