Asemmisa {{asɛmmisaAhyɛnsode}}
1.


The picture shows one of the phases of the moon. Predict how much of the moon will be lit two weeks later and the cause of the illumination.

Travis collected data about temperature during each season and put the results in a table. How can Travis identify and use the pattern and complete his table? Write the letter of ONE correct answer on each line. Some answers may not be used.
 PART A
The average temperature during fall would be
Travis collected data about temperature during each season and put the results in a table. How can Travis identify and use the pattern and complete his table? Write the letter of ONE correct answer on each line. Some answers may not be used.
PART B
The average temperature during fall would be
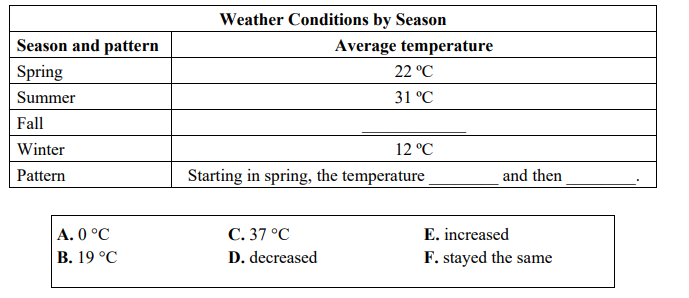
D. decreased
E. increased
F. stayed the same
Clint lives in Anchorage, Alaska. He goes to a year-round school. Some mornings it is dark at his bus stop. Other mornings there is daylight. This graph shows sunrise times in Anchorage last year.

Analyze the data in the graph and identify any significant pattern. Use the graph to predict whether it will be light or dark at Clint’s bus stop at 6:30 a.m. during the year. Choose the letter of ONE correct answer from the dropdown
Month Ligth at bus stop at 6:30
February
June
August
November
This question has two parts. First answer Part A. Then answer Part B.
Lucca is studying the length of day in a town in North Dakota. He records the sunrise time and sunset time on the fifteenth day of every month for one year. He calculates the number of daylight hours and minutes for those days. Lucca records his data in a table.

Part A
Which answer BEST describes the pattern Lucca can identify in his data?

Part B
Which of these BEST supports the answer from Part A?

Kendra’s class was learning about what causes moon phases. They learned that the way the sun, Earth, and moon’s positions change make the moon look like it does at different times. They made a chart with some different moon phases and the causes of the moon phases. Write the letter of each moon phase in the box next to the correct cause.
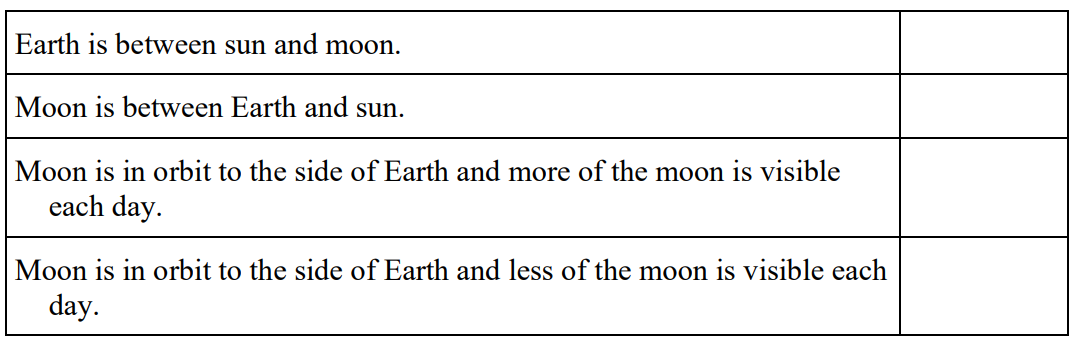
D. full moon
B. new moon
C. third quarter
A. First Quarter
Look at the picture of this phase of the moon. Predict if the illumination of the moon will increase or decrease over the next week AND explain how you know that the moon will change like you predicted. Read the question carefully. Then write your prediction and explanation on the lines provided.
