Food Coloring Spreading in Water
Diagram 1.
 Source: https://www.istockphoto.com/search/2/image-film?phrase=food+coloring+in+water
Diagram 2.
Source:
https://animalia-life.club/qa/pictures/food-coloring-in-water-diffusion
Phenomenon:
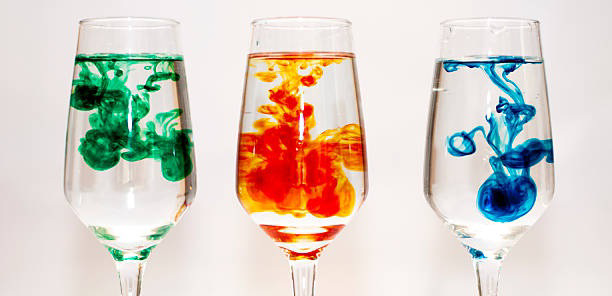
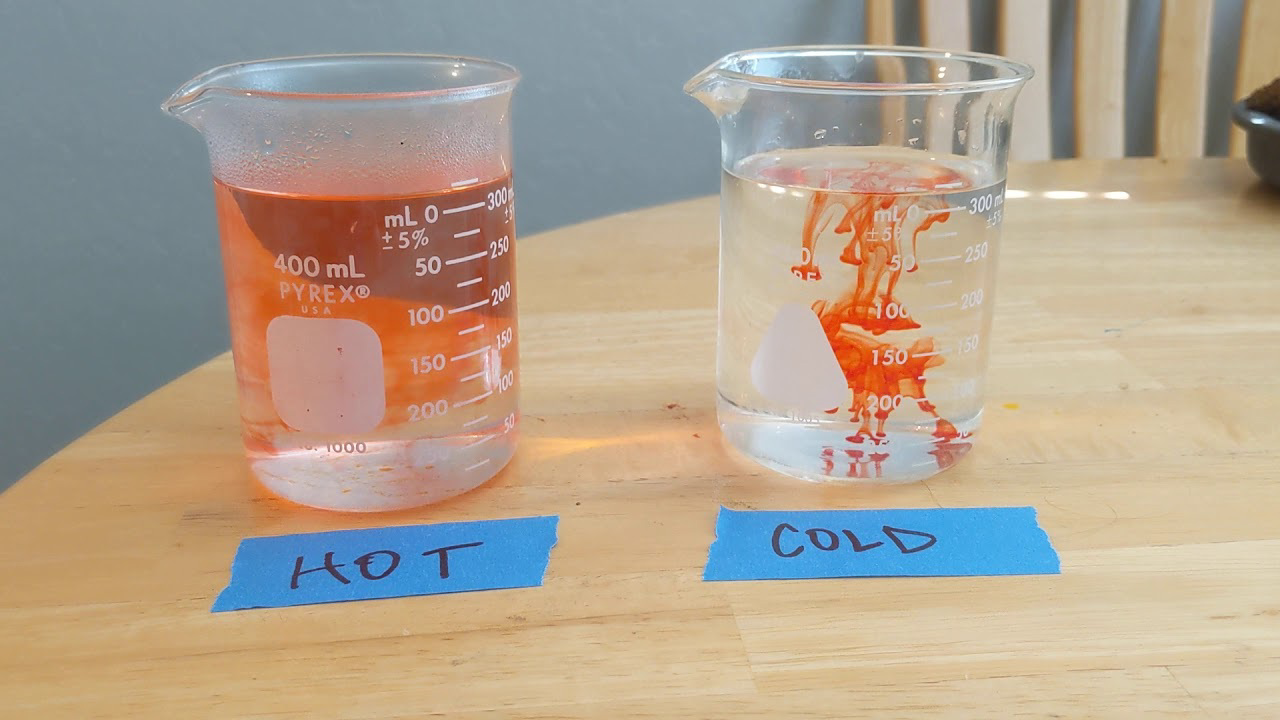
Students place a single drop of food coloring into a clear cup of still water. At first, the drop stays together as a dark swirl. But over several minutes, the color slowly spreads throughout the cup until the entire mixture looks evenly tinted. No stirring, no shaking - yet the color still moves.
Students wonder:
How can the color spread if no one touched the water?
This phenomenon helps students model that matter is made of tiny particles that are always moving, even when we cannot see them.
When food coloring spreads through water without stirring, it shows that both the water and the coloring are made of particles too small to see. Right after the drop enters the water, it forms a small cloud of color. But water particles are always moving. They bump, slide, and drift past one another, even in still water.
As the water particles move, they push and pull on the food-coloring particles. The coloring particles break apart from the original drop and slowly spread out. Over time, these tiny particles mix until the color becomes even everywhere in the cup.
Nothing is “carrying” the color except the movement of particles themselves. Even though the particles are invisible, their movement creates visible changes. The spreading pattern is called diffusion, and it only happens because matter is made of tiny pieces that are constantly moving.
If students watch closely, they can see the color swirl, stretch, and fade as it blends. These observations provide evidence that matter does not have to be seen to be real. The movement of food coloring in water is a strong clue that matter is made of tiny, always-moving particles.
Table 1.
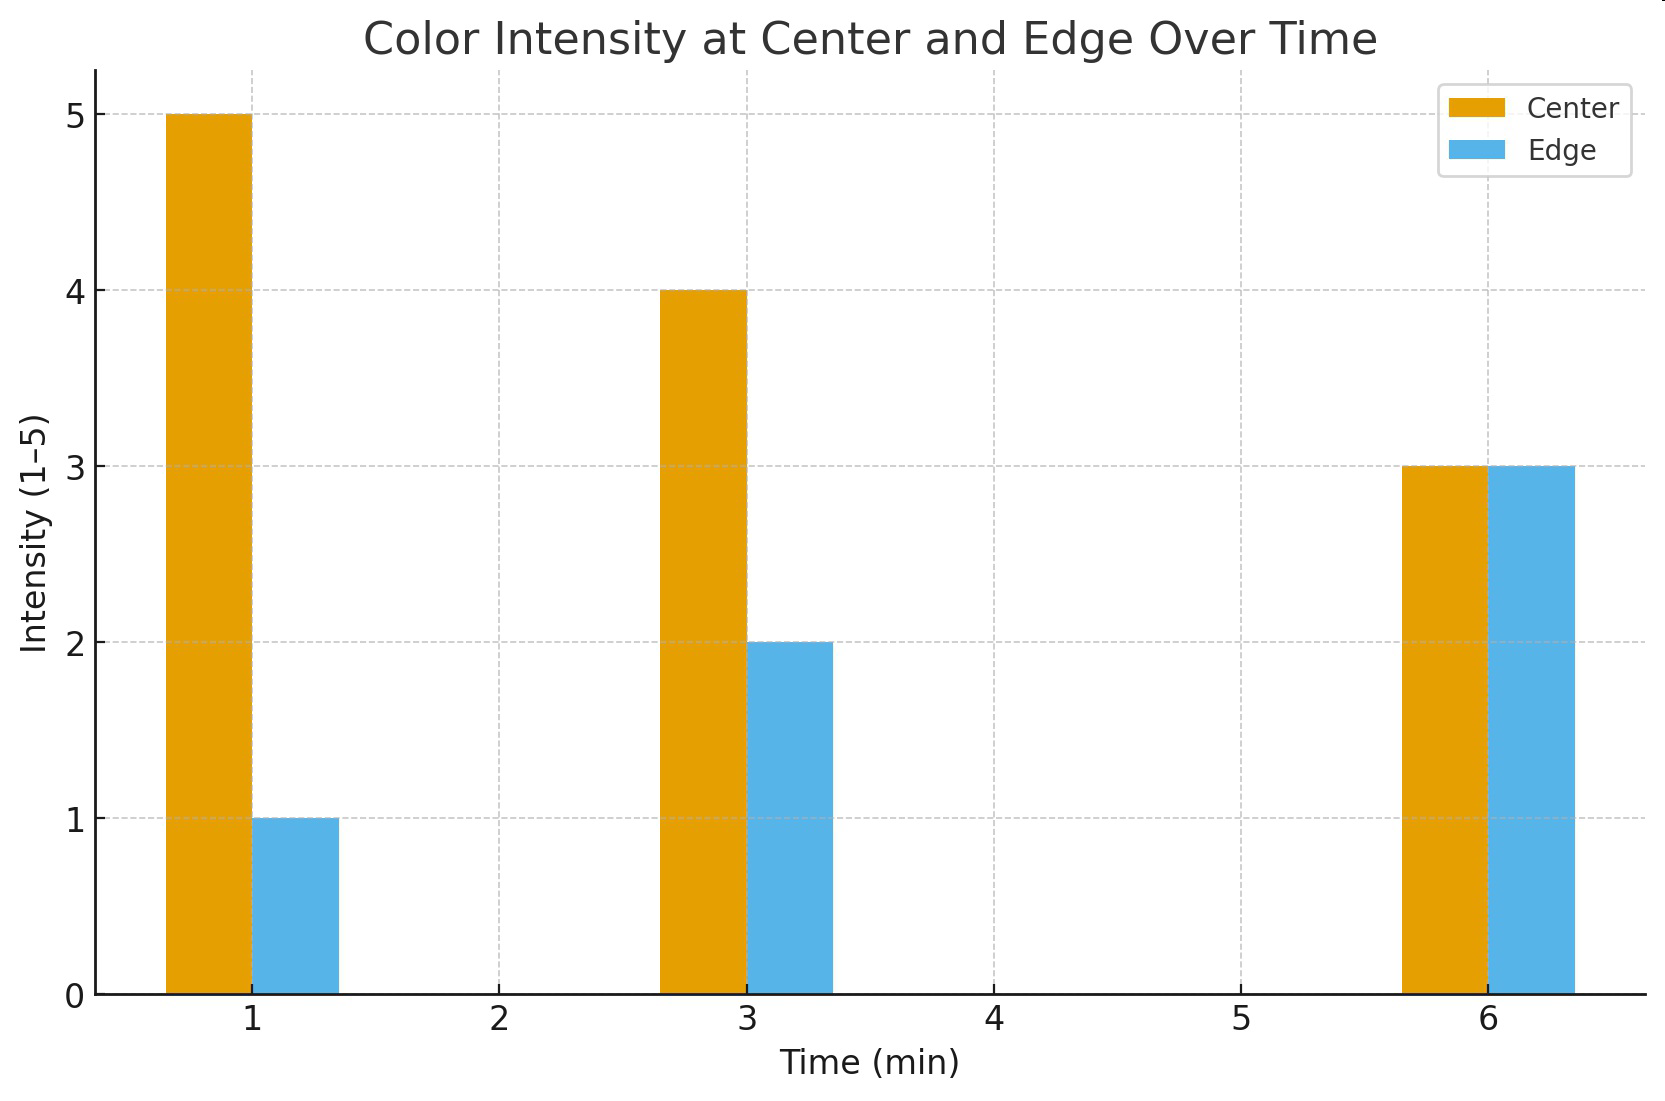
Time (min) | Diameter of Color Cloud (cm) | Center Intensity | Edge Intensity |
|---|
1 | 3 | 5 | 1 |
3 | 6 | 4 | 2 |
6 | 10 | 3 | 3 |
Graph of Information - Figure 1.
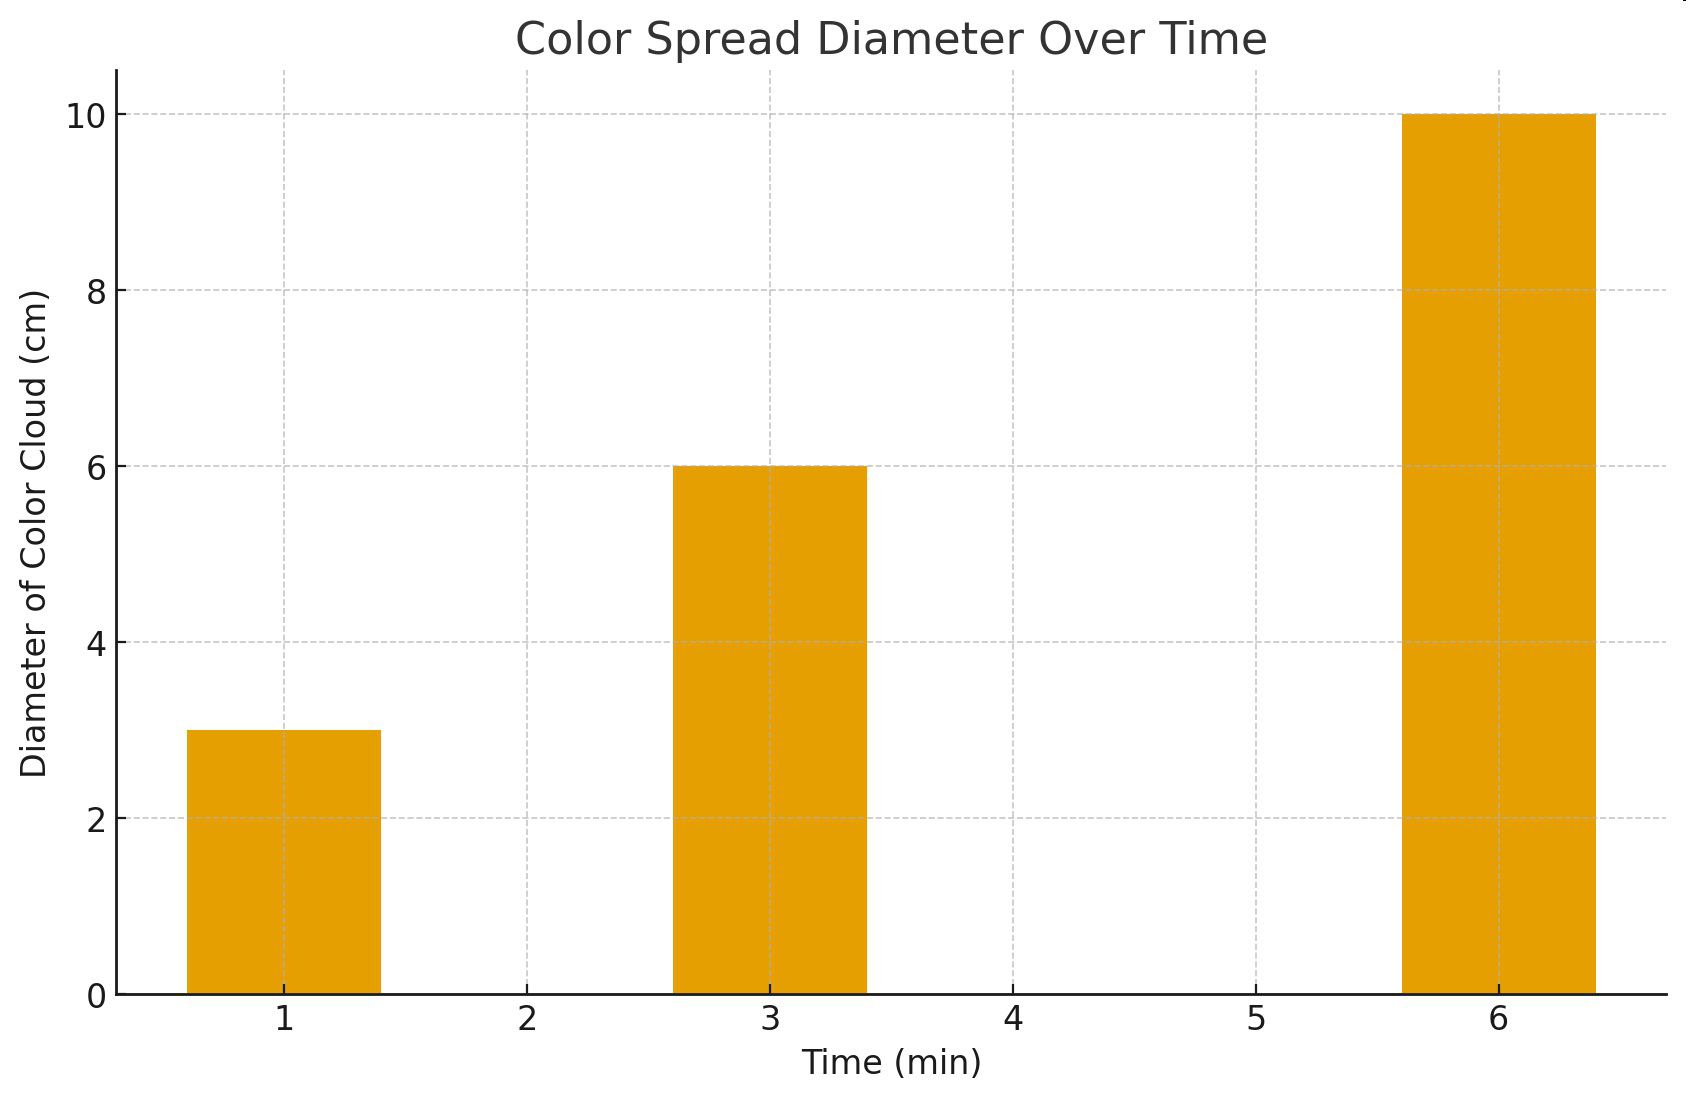
Graph of Information - Figure 2.