Sound Waves Making Rice Jump
Diagram 1.
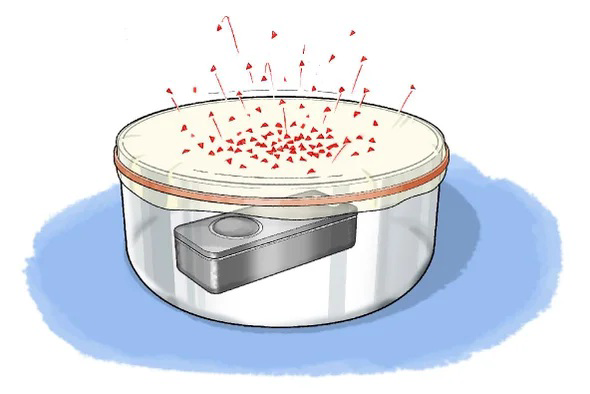
Source: https://www.scientificamerican.com/article/making-sound-waves/
Phenomenon
Students stretch plastic wrap tightly over the top of a bowl and place a few grains of dry rice on the surface. When a speaker or phone plays sounds nearby, the rice grains begin to jump and vibrate. Louder sounds make the rice move more, while softer sounds cause little movement.
Students ask:
How can waves we cannot see cause objects to move?
This investigation helps students model how sound waves have amplitude and how waves transfer energy that can move objects.
Sound is a type of wave that travels through air. Even though sound waves cannot be seen, they are made of vibrations that move energy from one place to another. When something makes a sound, it causes nearby air particles to vibrate back and forth. These vibrations travel outward as a wave.
One important feature of sound waves is amplitude. Amplitude describes how strong the vibrations are. Loud sounds have greater amplitude, while quiet sounds have smaller amplitude. Greater amplitude means more energy is being transferred by the wave.
When sound waves reach the plastic wrap, they cause it to vibrate. These vibrations transfer energy to the rice grains resting on top. If the sound has a larger amplitude, the vibrations are stronger, and the rice moves more. If the sound has a smaller amplitude, the vibrations are weaker, and the rice moves less.
Diagram 2.
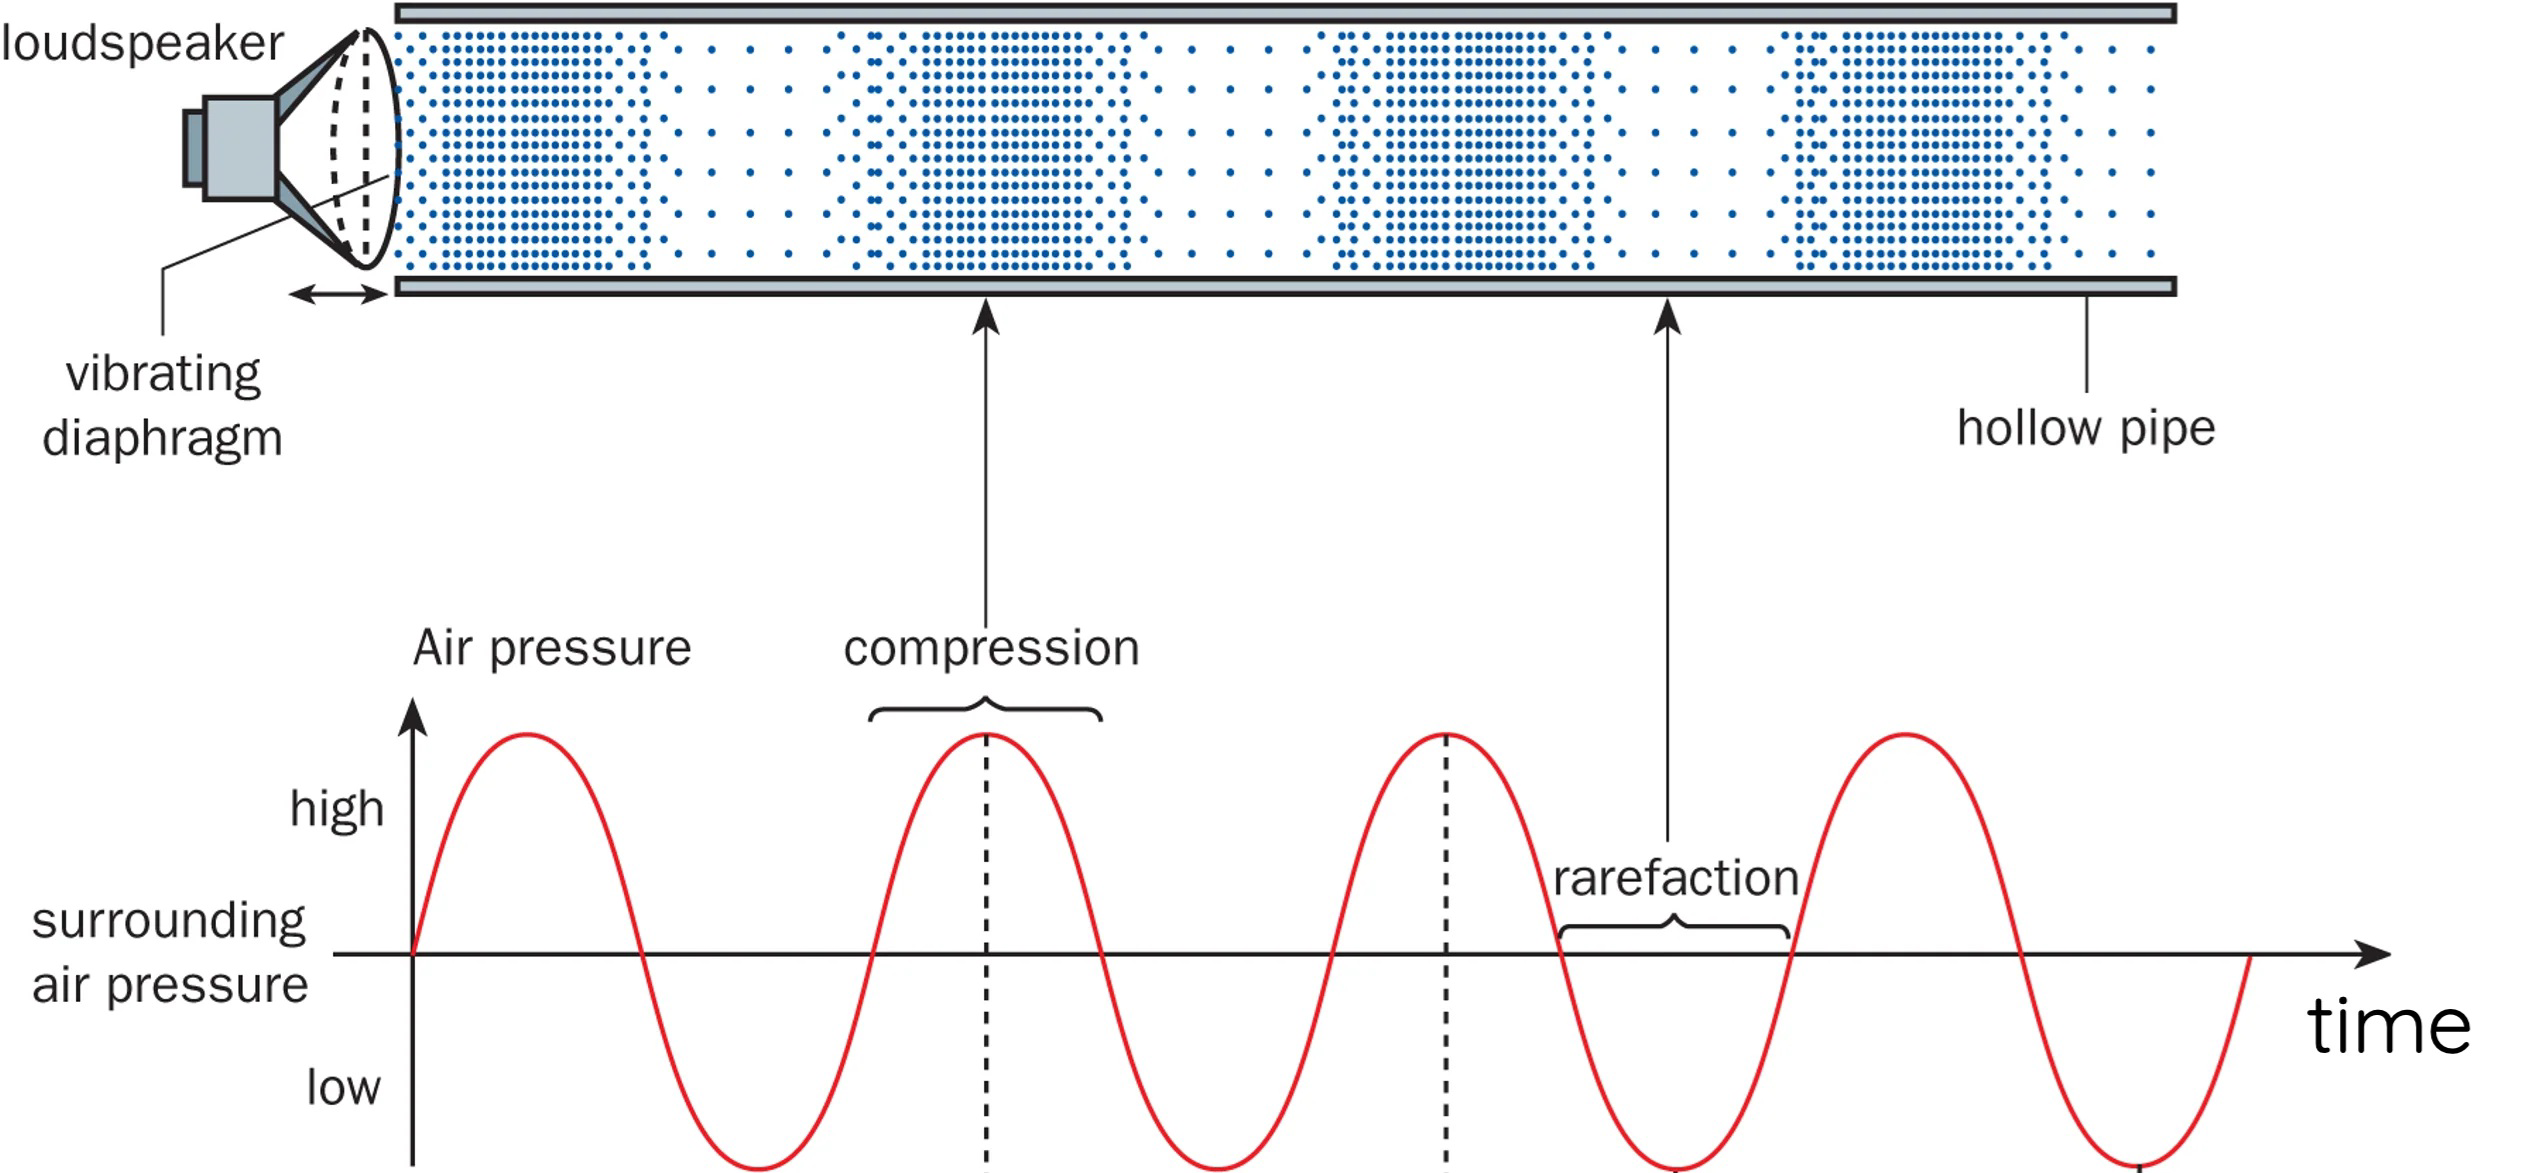
Source: https://scienceready.com.au/pages/introduction-to-sound-waves
By observing how changes in sound amplitude affect rice movement, students can build a model that shows how waves have patterns and how waves can cause objects to move, even when the waves themselves cannot be seen.
Table 1.
Trial | Sound Volume Level | Rice Movement Height (cm) |
|---|---|---|
1 | Low | 0.2 |
2 | Medium | 0.6 |
3 | High | 1.2 |
4 | Very High | 1.8 |
Graph of Information - Figure 1.
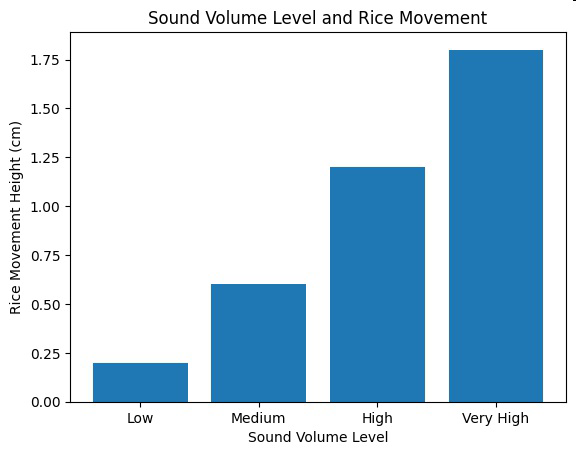
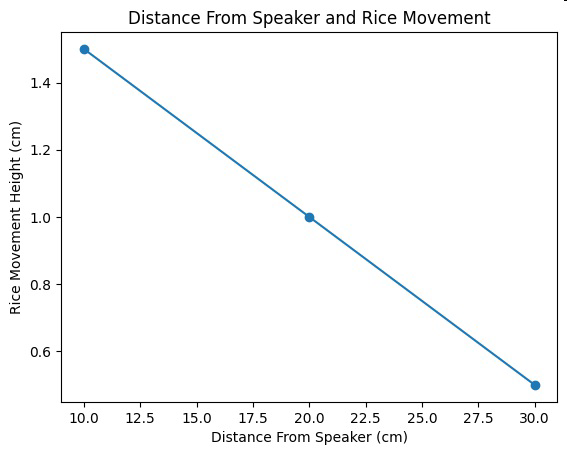
Table 2.
Trial | Distance From Speaker (cm) | Rice Movement Height (cm) |
|---|---|---|
1 | 10 | 1.5 |
2 | 20 | 1 |
3 | 30 | 0.5 |
Graph of Information - Figure 2.