Preskoči na glavni sadržaj
Prijava
Sign up for FREE
arrow_back
Biblioteka

Friday 5/8 - 5/6th | Bar Graphs Day 02

star
star
star
star
star
Posljednje ažuriranje about 7 hours ago
10
Practice 1

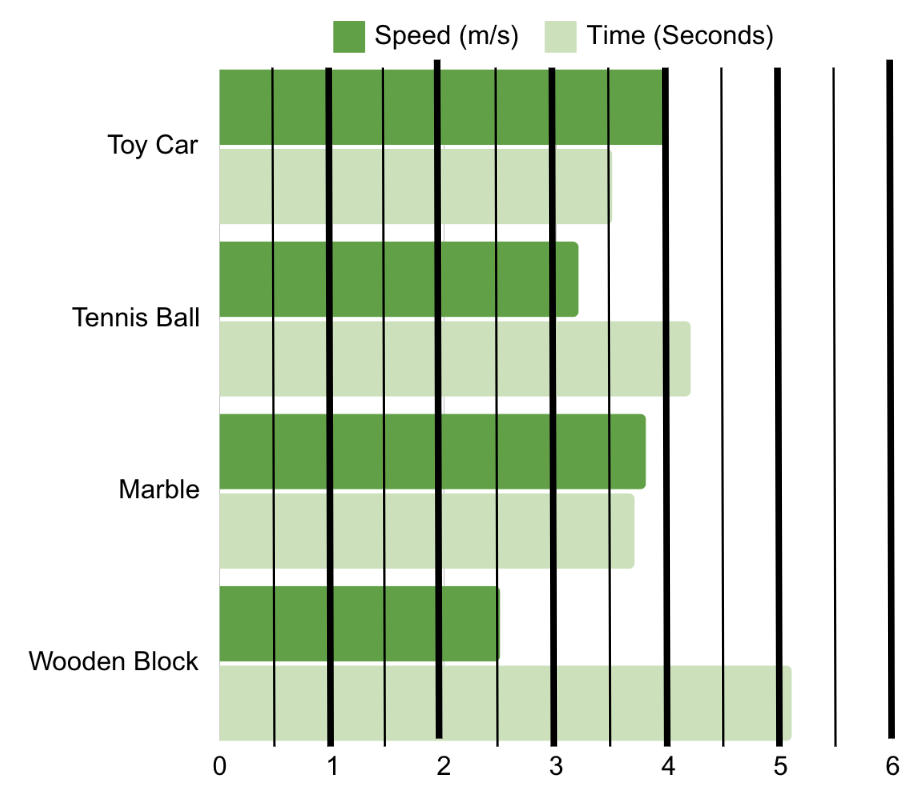
Students rolled different objects down a ramp and recorded their speed in meters per second (m/s).
0
Pitanje 1
1.

Which object traveled the slowest? How do you know?

0
Pitanje 2
2.

Which object traveled the fastest? How do you know?

0
Practice 2
Exit Ticket - Practice 3
Pitanje 3
3.

Based on the graph, what is the relationship between the speed of an object and the amount of time it took to roll down the ramp?

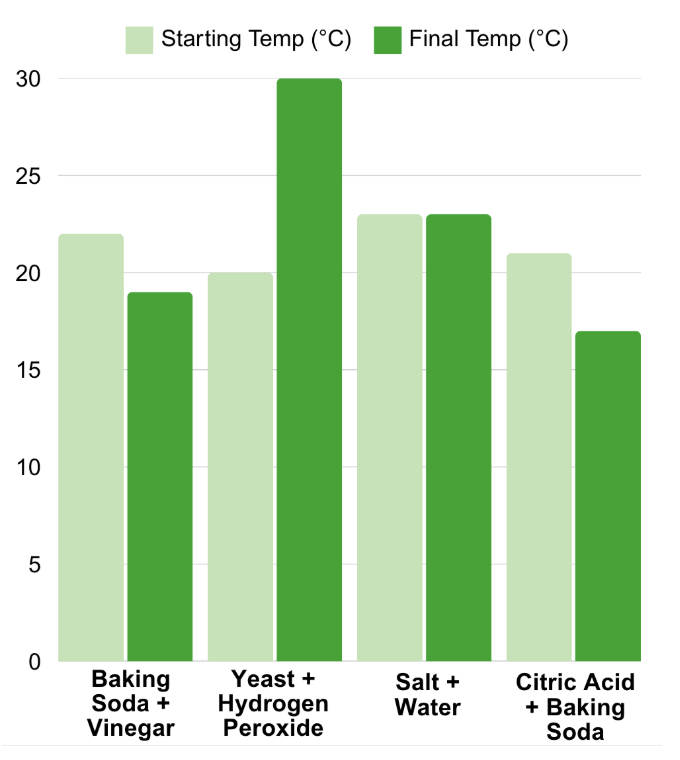
Students mixed different chemicals and recorded the temperature change in degrees Celsius (°C).

0
Pitanje 4
4.

Which reaction caused the greatest temperature increase? How do you know?

0
Pitanje 5
5.

Which reaction caused the greatest temperature decrease? How do you know?

0
Pitanje 6
6.

Why do some reactions cause temperature increases while others cause decreases?

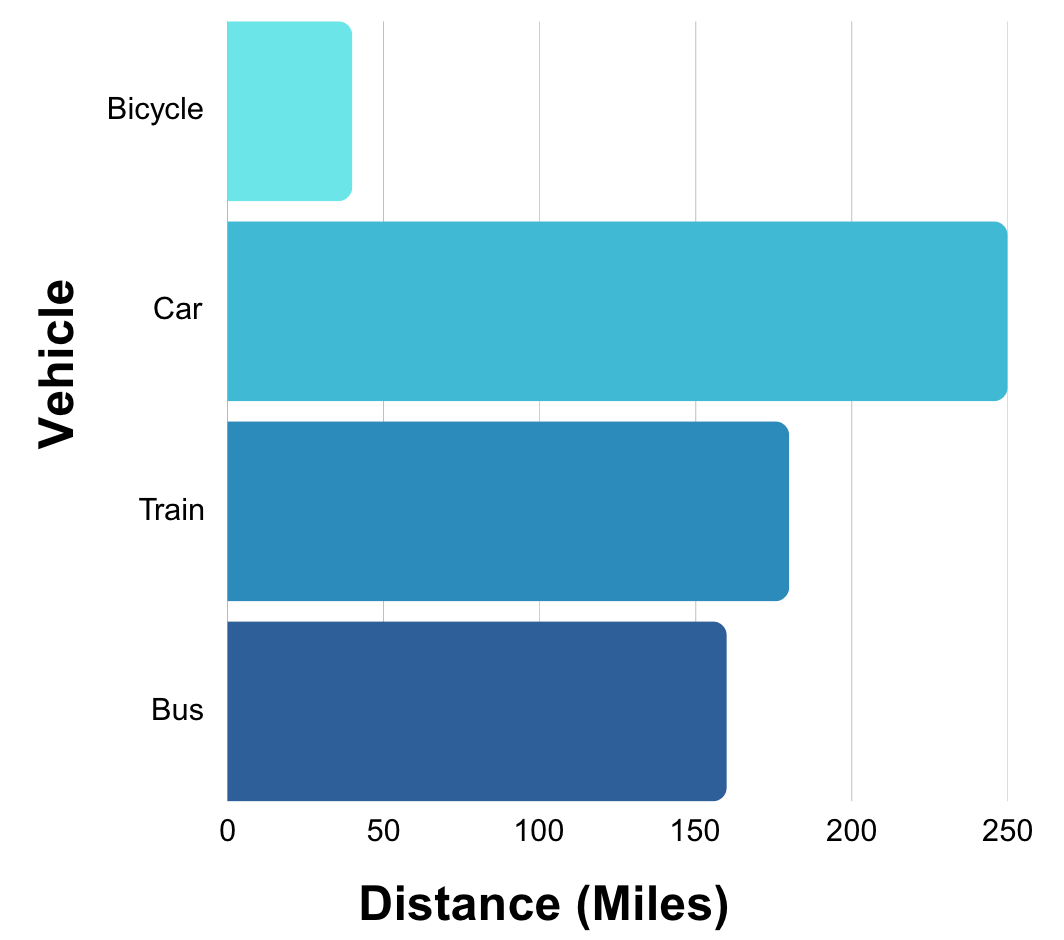
The graph shows how far different vehicles traveled in 5 hours.

1
Pitanje 7
7.

Which vehicle went the farthest distance?

1
Pitanje 8
8.

Which vehicle went the shortest distance?

4
Pitanje 9
9.

Calculate the speed for each vehicle using speed = distance ÷ time.

Speed of Bike =

Speed of Car =

Speed of Train =

Speed of Bus =

1
Pitanje 10
10.

Which vehicle had the fastest speed?