Preskoči na glavni sadržaj
Prijava
Sign up for FREE
arrow_back
Biblioteka

Y5 Statistics L2: Different data representations

star
star
star
star
star
Posljednje ažuriranje 4 months ago
15
1
S.2
1
1
S.2
1
S.2
1
S.2
1
S.2
1
S.2
1
S.2
1
S.2
1
S.2
1
S.2
1
S.2
1
S.2
1
S.2
0
Pitanje 1
1.

Review:

Here is a train timetable
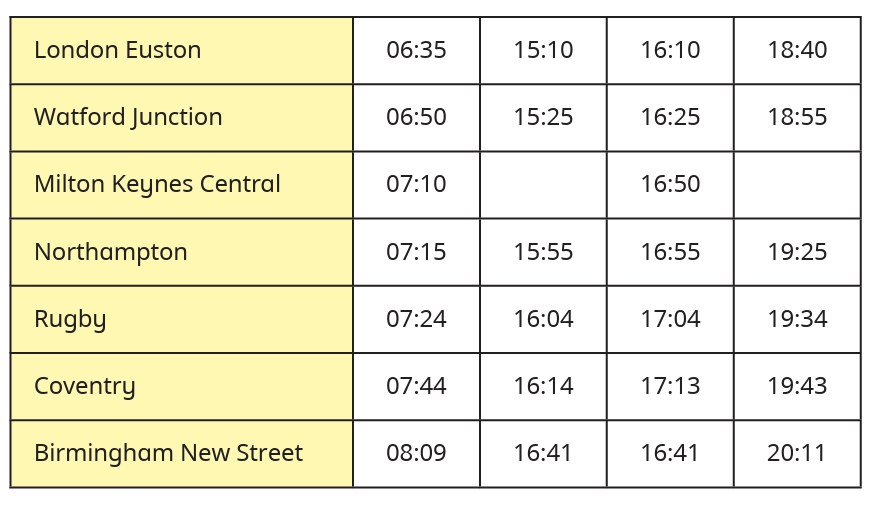
Ron gets a train from Watford Junction to Rugby. He arrives in Rugby at 16:04. What time did he get on the train?
Pitanje 2
2.

This will be marked after the lesson.

Pitanje 3
3.

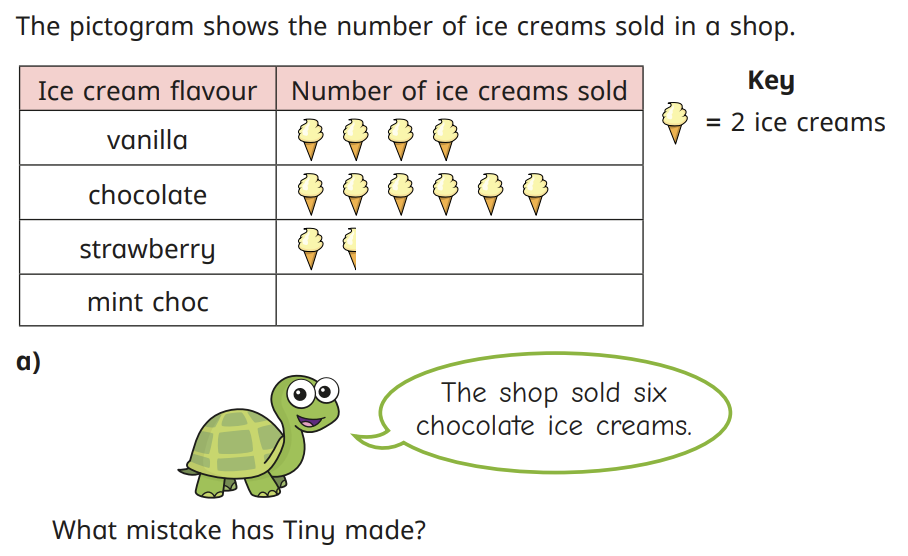
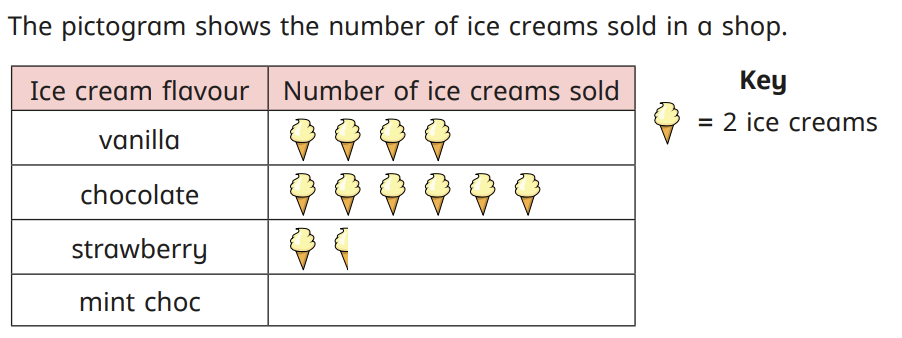
How many more vanilla ice creams were sold than strawberry?

Pitanje 4
4.

Draw on the pictogram to show that seven mint choc ice creams were sold.

This will be marked after the lesson.

Pitanje 5
5.

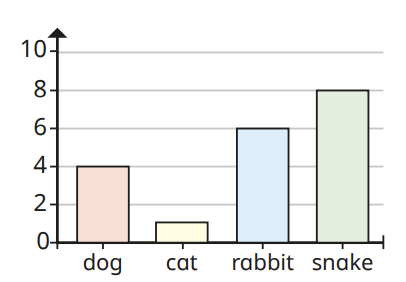
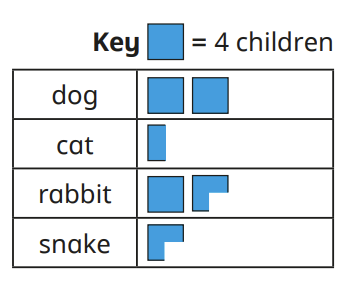
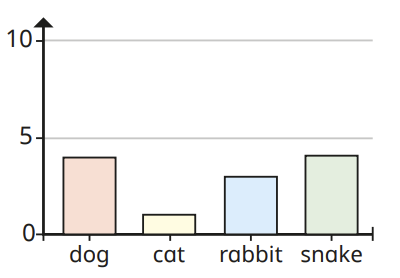
A class of children were asked what their favourite animals are. Which class (A, B, C or D) is represented in this chart?
Pitanje 6
6.

A class of children were asked what their favourite animals are. Which class (A, B, C or D) is represented in this chart?

This will be marked after the lesson.

Pitanje 7
7.

A class of children were asked what their favourite animals are.
How many students are in this class?

Pitanje 8
8.

What do the numbers at the bottom represent?

This will be marked after the lesson.

Pitanje 9
9.

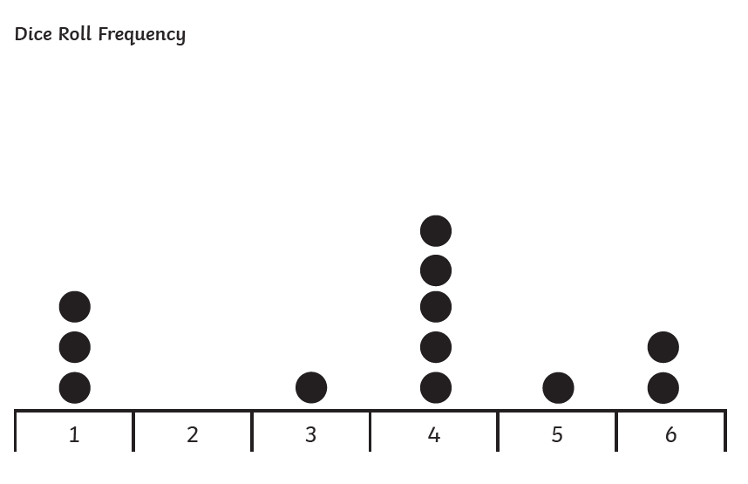
How many times was a number lower than "3" rolled?

Pitanje 10
10.

How many times was the dice rolled?

This will be marked after the lesson.

Pitanje 11
11.

How many more times was a "4" rolled than a "5"?

Pitanje 12
12.

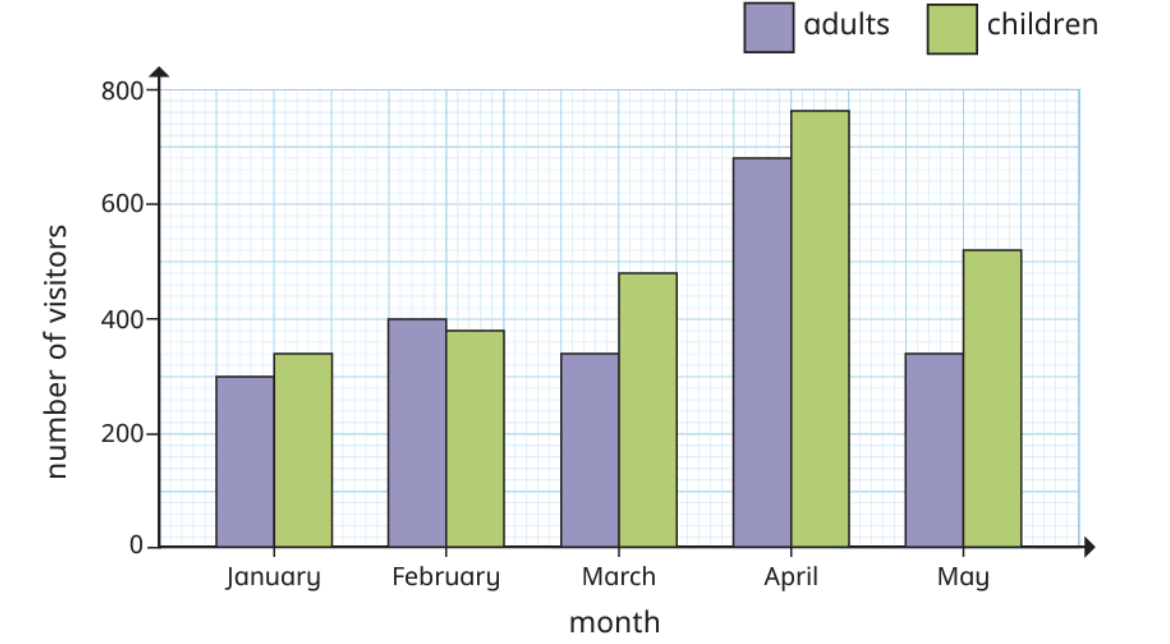
How many visitors (adult and children) did the museum have in January?

Pitanje 13
13.

What is the difference between the number of adults who visited in March and the number of children who visited in March?

Pitanje 14
14.

hot_pepper emoji In June, the number of visitors decreased by 130 compared to the number of visitors in May. How many visitors went to the museum in June? (Make sure you work this out in your books!)

This will be marked after the lesson.

Pitanje 15
15.

Rate your confidence level with this lesson!