Twa kɔ nsɛm atitiriw so
Log in
Sign up for FREE
arrow_back
Laabri

Statistics (2) Check-up

star
star
star
star
star
Last updated 3 months ago
9 Nsɛmmisa
Ɛhia
10
Ɛhia
10
Ɛhia
4
Ɛhia
1
Ɛhia
1
Ɛhia
6
Asemmisa {{asɛmmisaAhyɛnsode}}
1.

Frequency Charts


Use the data to complete the frequency table. The following are the heights of a year 6 class in centimeters:

157 161 166 157 155 166 158 157 166 158 159 162 161

160 162 165 162 164 164 158 160 165 157 161 158 166

Height (cm)

Tally

Frequency

Ɛhia
1
Asemmisa {{asɛmmisaAhyɛnsode}}
2.

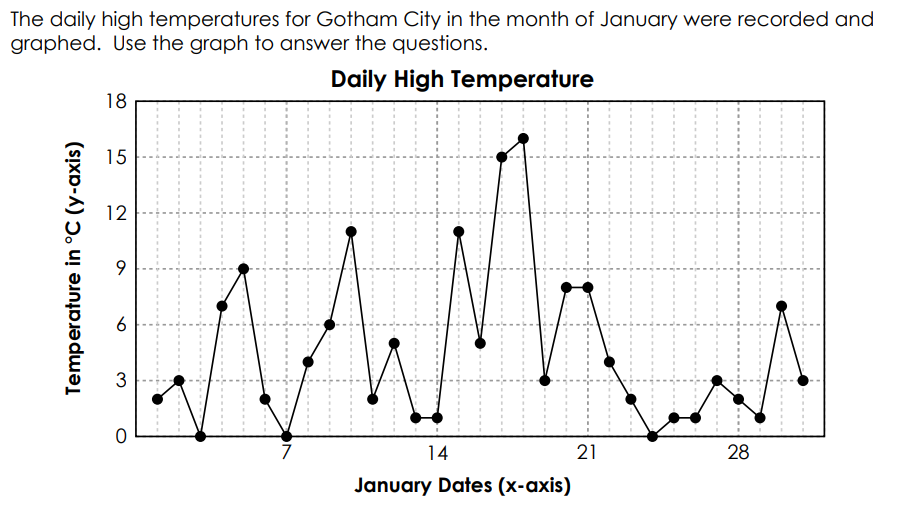
What was the temperature in Gotham City on January 10?

Ɛhia
1
Asemmisa {{asɛmmisaAhyɛnsode}}
3.

On which two days was Gotham City’s temperature 7°C?

Ɛhia
1
Asemmisa {{asɛmmisaAhyɛnsode}}
4.

On which day did Gotham City have the highest temperature?

Asemmisa {{asɛmmisaAhyɛnsode}}
5.

Use the information in the tally table and complete the line graph.

Number of meals sold by the cafeteria in break 1


Sunday

12

Monday

8

Tuesday

10

Wednesday

6

Thursday

15

Asemmisa {{asɛmmisaAhyɛnsode}}
6.

Question 3: Scatter Graphs

Construct a scatterplot for the data about Math and English test scores for a group of students given below. The first has been done for you.

Asemmisa {{asɛmmisaAhyɛnsode}}
7.

Question 4: Dot Plots
The dot plot below shows the number of goals scored by the school football team. For each of the following statements state whether they are true or false .

The team scored at least one goal in every match.

Asemmisa {{asɛmmisaAhyɛnsode}}
8.

Question 4: Dot Plots
The dot plot below shows the number of goals scored by the school football team. For each of the following statements state whether they are true or false.

In most of their matches, the team scored 3 or less goals.

Asemmisa {{asɛmmisaAhyɛnsode}}
9.

The data below shows the number of children in 16 families. Use the information to create a dot plot.

6

2

1

3

2

1

2

3

4

2

5

1

2

4

1

6