6OL Data Test Review
star
star
star
star
star
Last updated 5 months ago
12 Nsɛmmisa
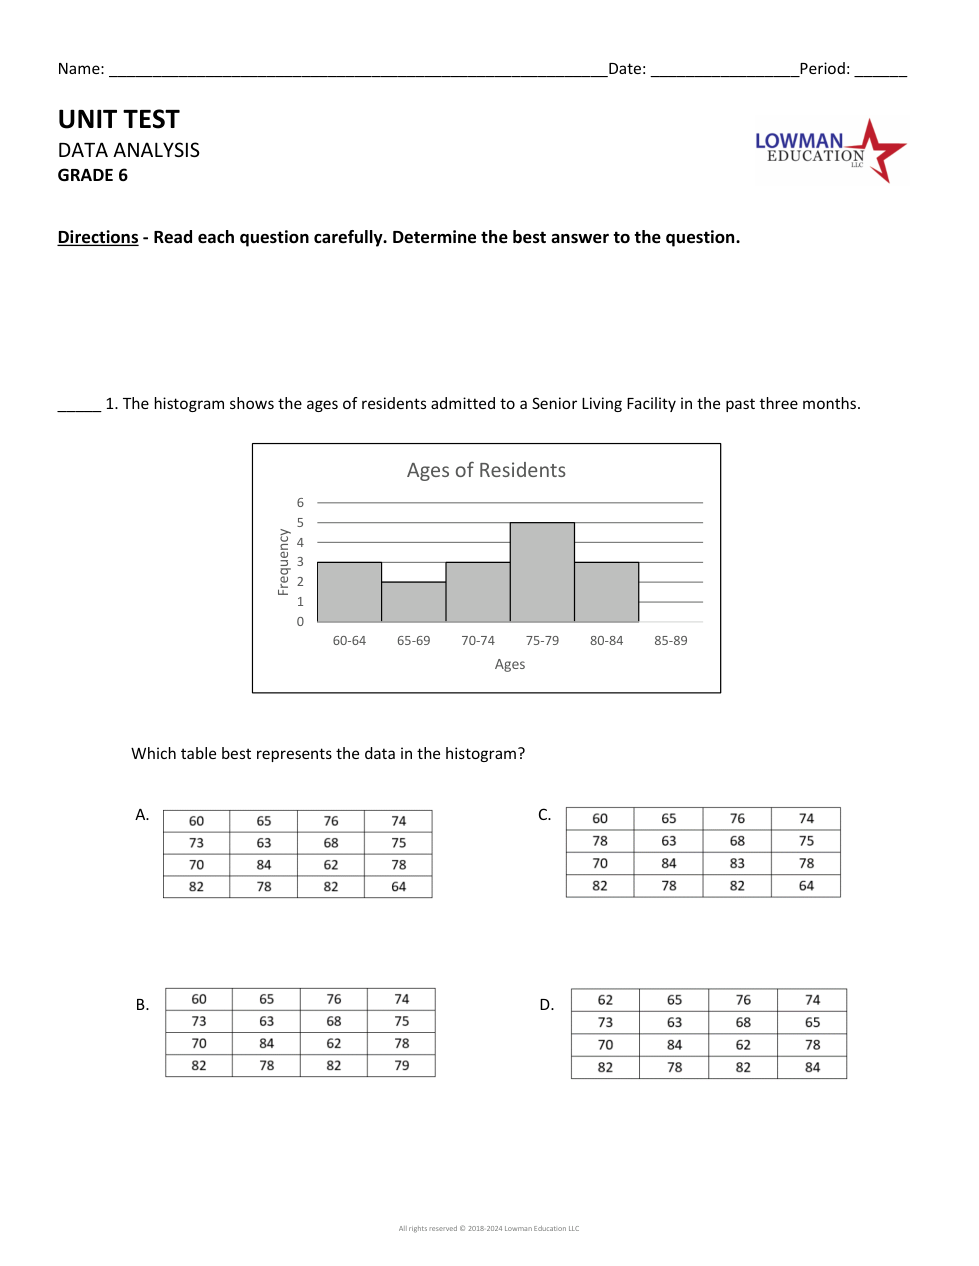
1
Which table best represents the data in the histogram?
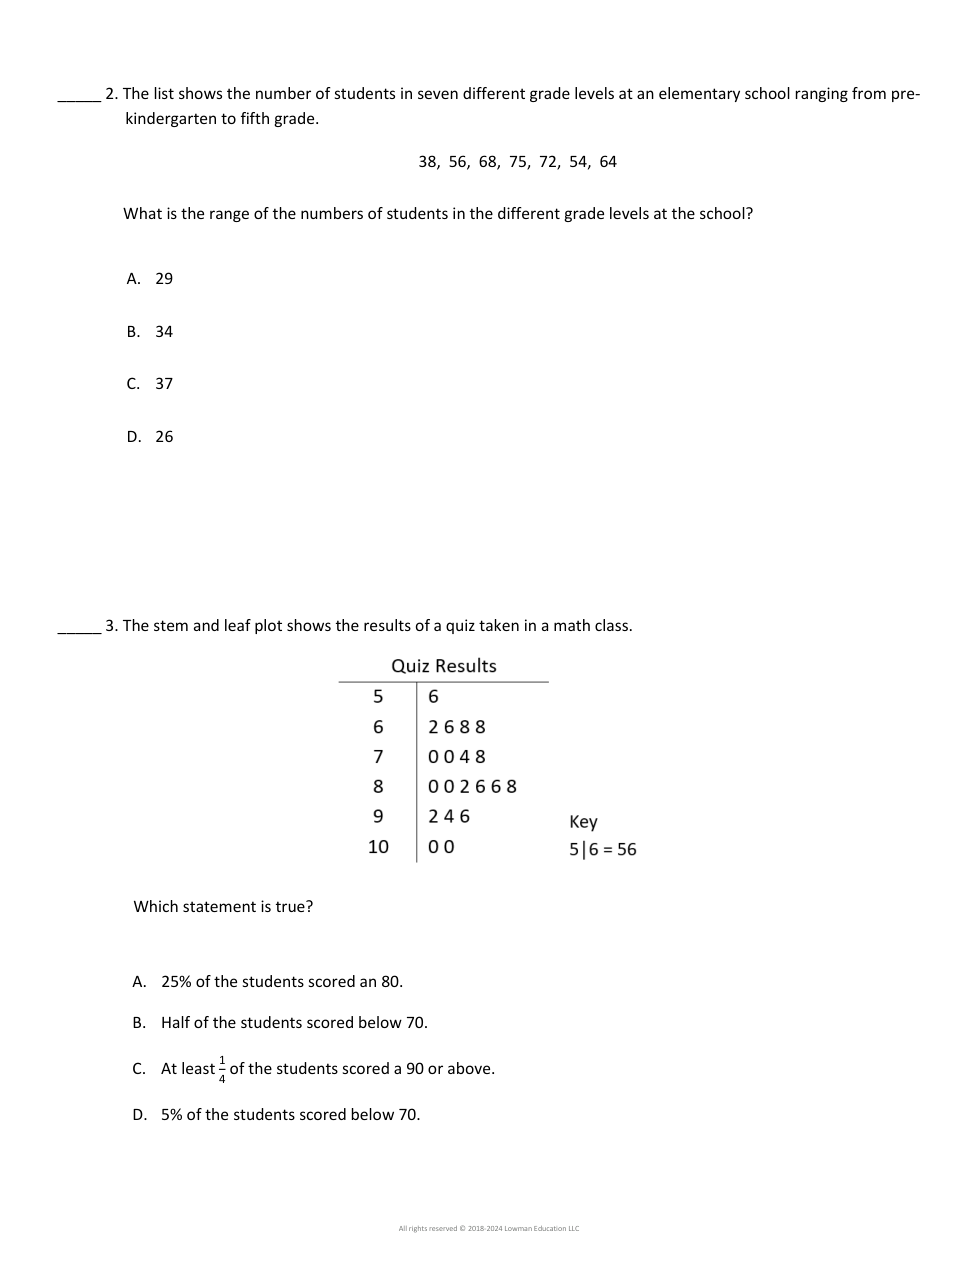
What is the range of the numbers of students in the different grade levels at the school?
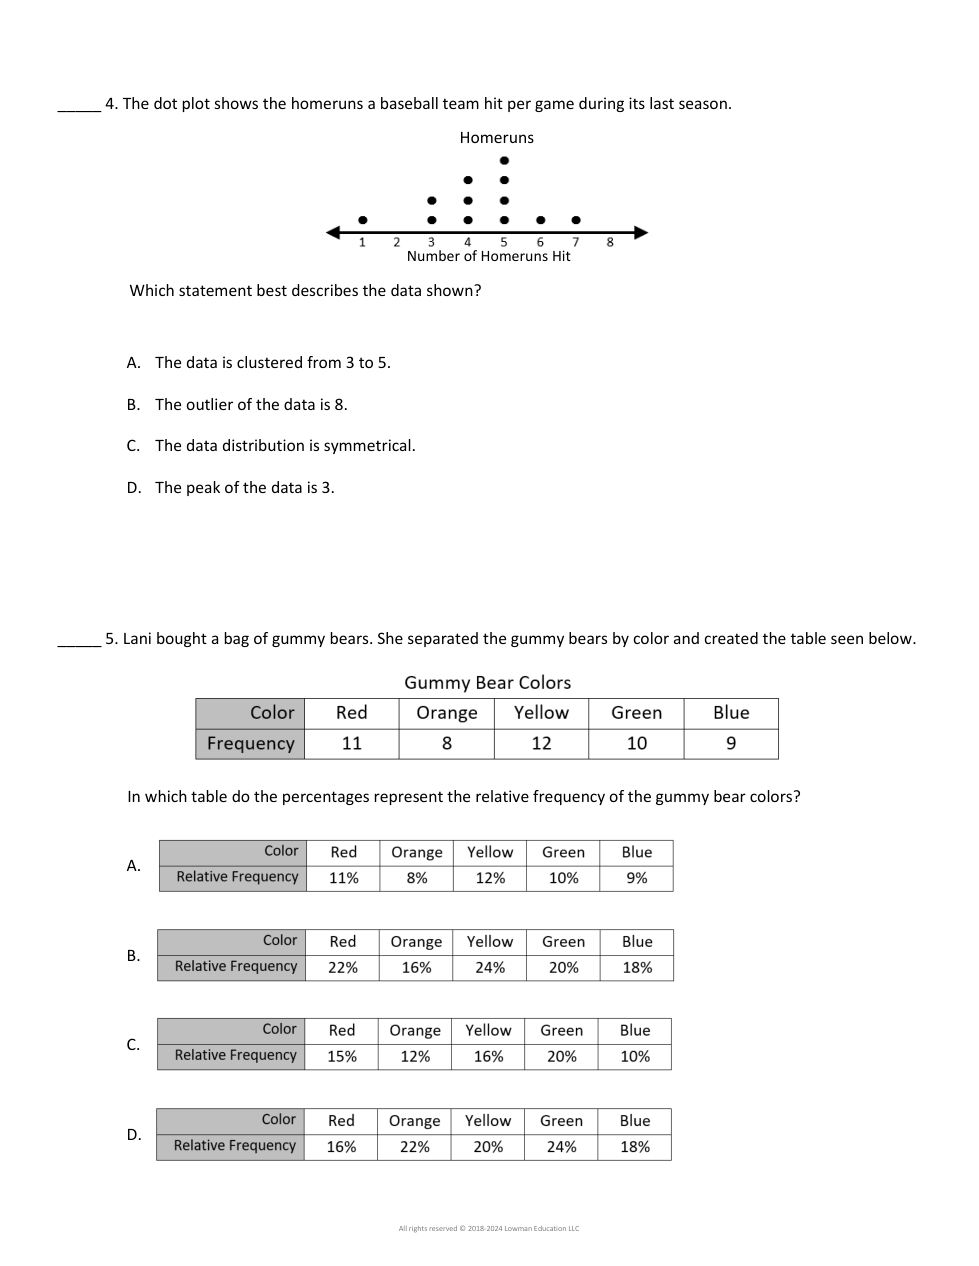
Which statement best describes the data shown?
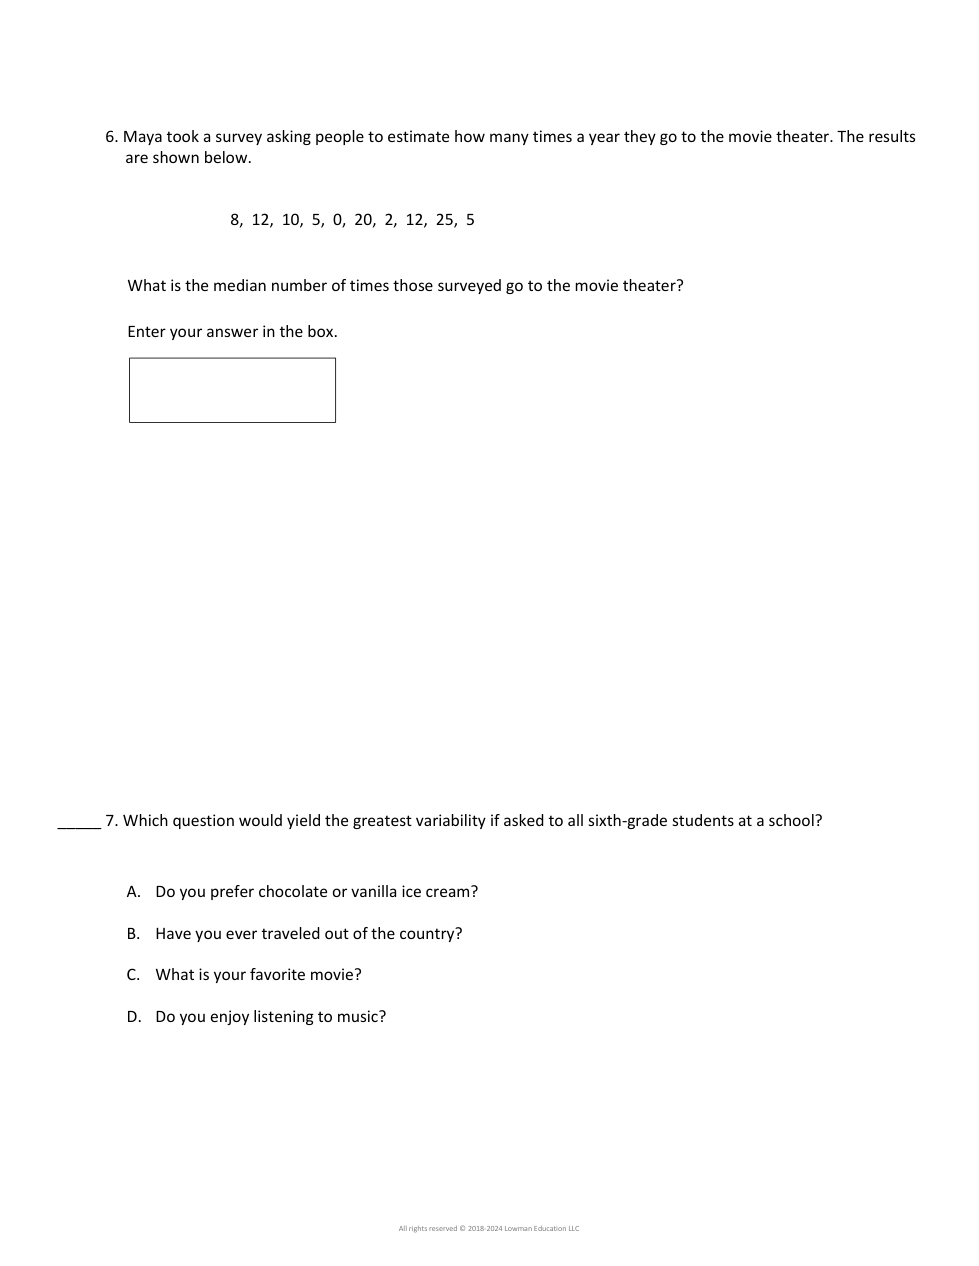
What is the median number of times those surveyed go to the movie theater?
Which question would yield the greatest variability if asked to all sixth-grade students at a school?
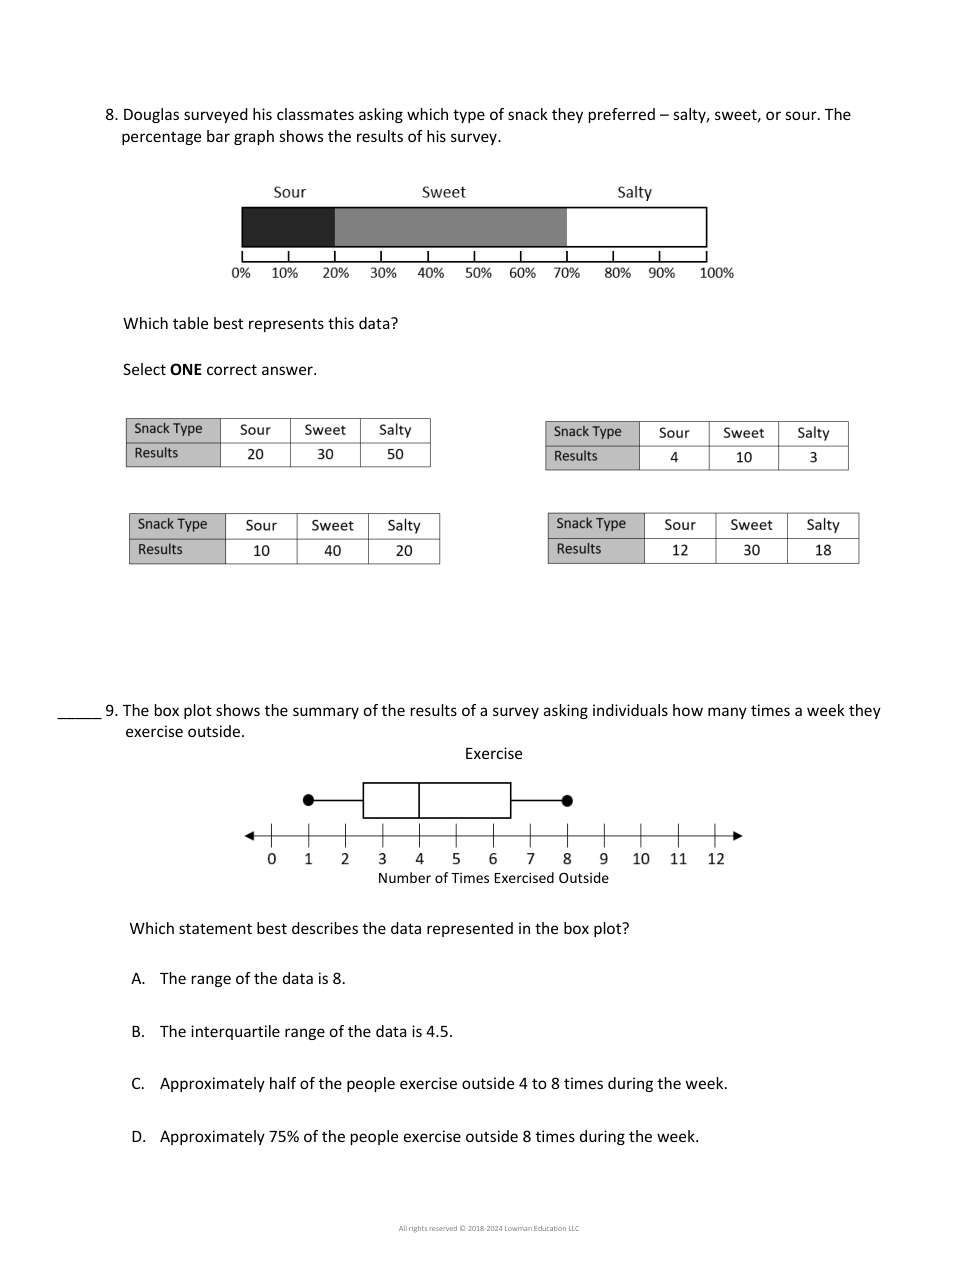
Which table best represents this data?
Which box plot best represents the data in the stem and leaf plot?
Which statement is true?
In which table do the percentages represent the relative frequency of the gummy bear colors?
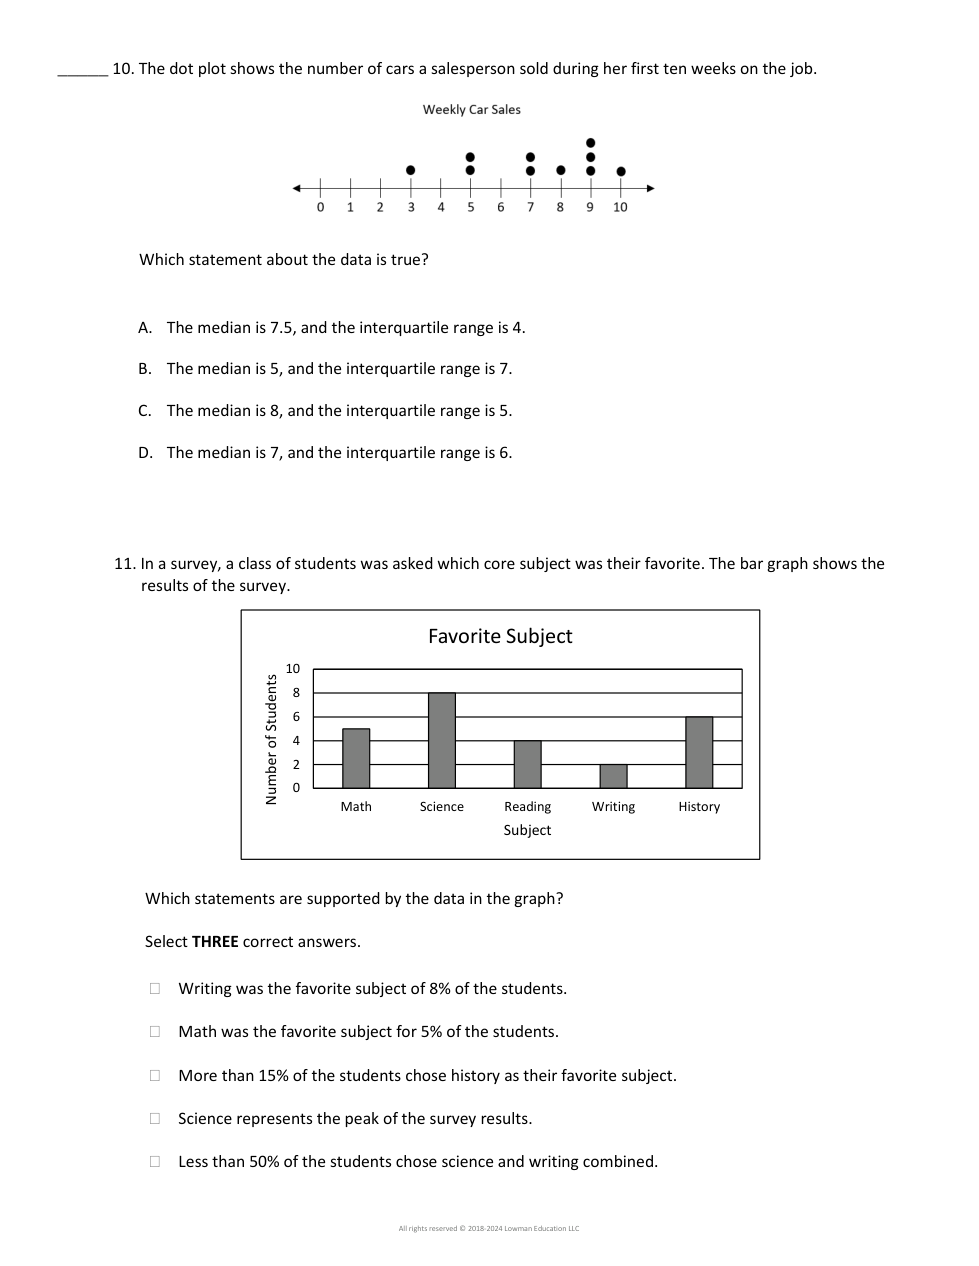
Which statement best describes the data represented in the box plot?
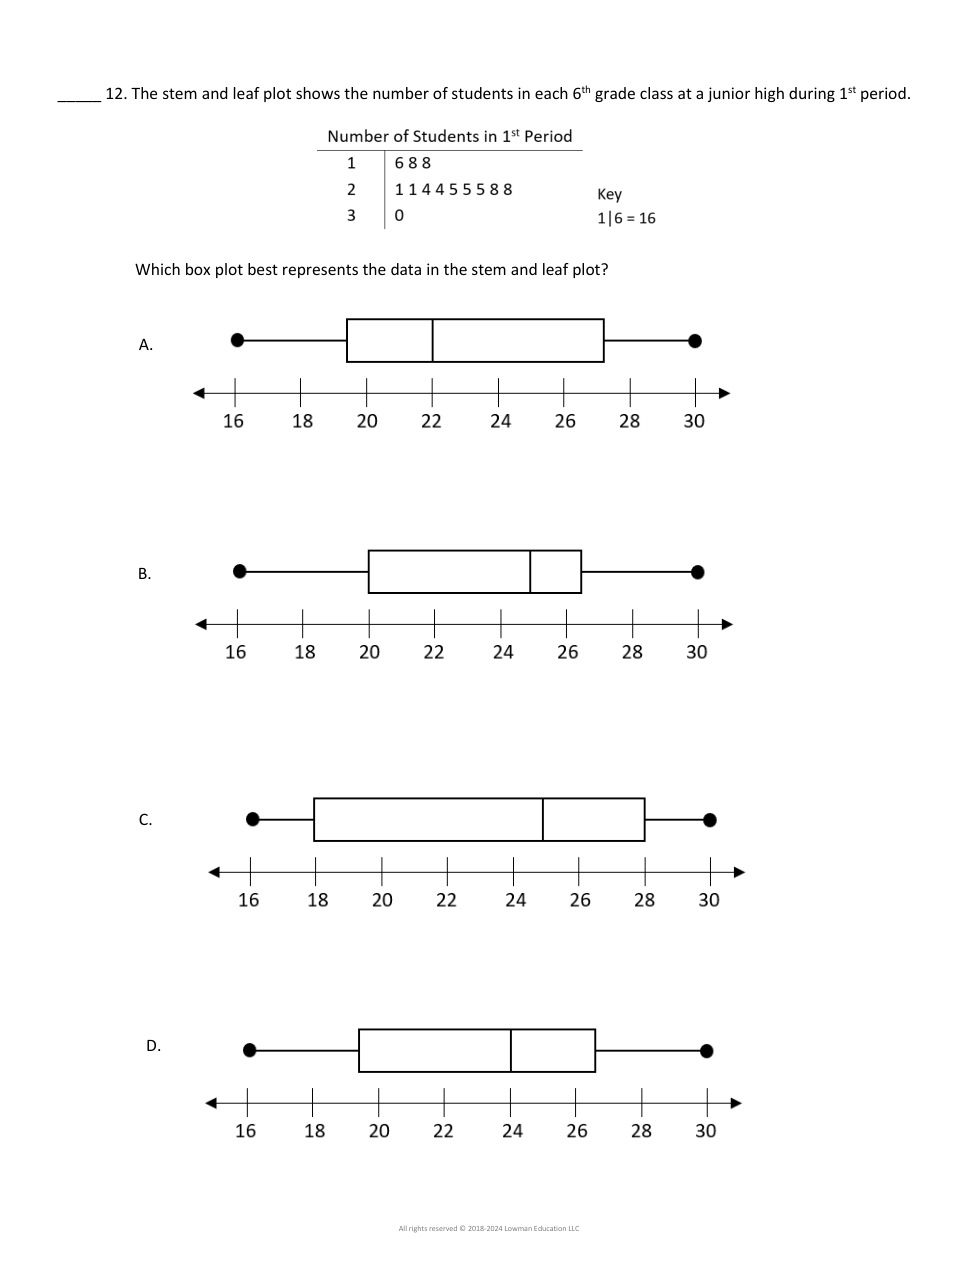
Which statements are supported by the data in the graph?
Select THREE correct answers.