Mitosis and Differentiation in Bone Marrow
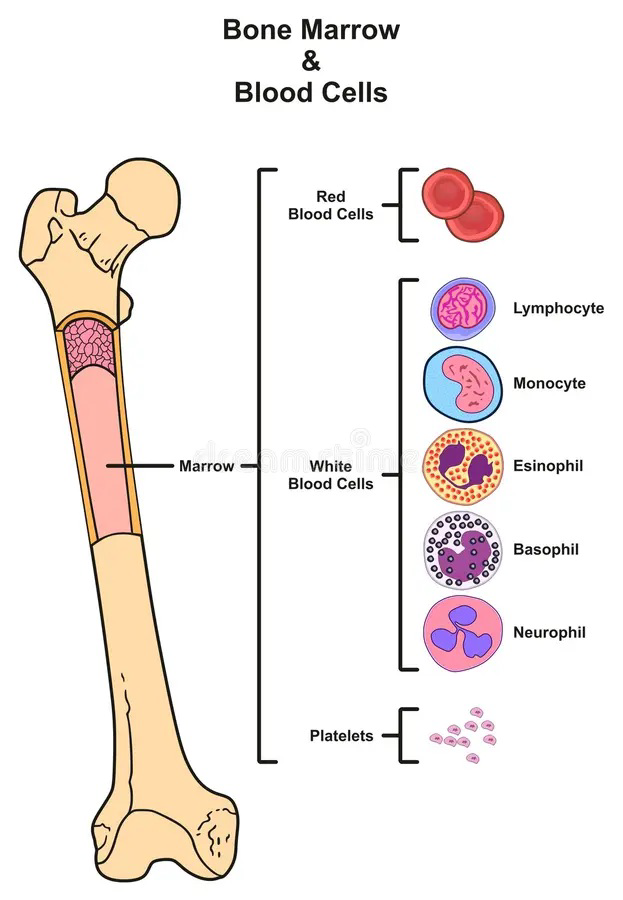
Inside human bones lies the soft, spongy tissue known as bone marrow. This tissue is responsible for producing all blood cells through a tightly regulated process called hematopoiesis. The driving forces behind hematopoiesis are mitosis, which increases cell number, and differentiation, which creates specialized blood cell types that carry out essential functions such as oxygen transport, immune defense, and blood clotting.
Hematopoietic stem cells (HSCs) are multipotent cells located in protected niches within the marrow. These HSCs can both self-renew by mitosis and differentiate into a wide range of mature blood cells. When the body is healthy, HSCs divide at a steady rate to replace red blood cells (RBCs), white blood cells (WBCs), and platelets as they naturally age and die. However, during illness or injury, the rate of mitosis and pathways of differentiation can change dramatically.
For example, during bacterial infections, the body requires more neutrophils to fight invading pathogens. Stem cells respond by increasing their mitotic rate and shifting differentiation toward neutrophil production. In contrast, anemia – characterized by low RBC levels – triggers increased production of erythrocytes. Conditions such as bone marrow suppression (due to toxins, chemotherapy, or disease) reduce mitosis, leading to dangerously low levels of all blood cell types.
Scientists evaluate hematopoiesis using measurable variables such as mitotic index, RBC output, WBC output, and proportional differentiation into various blood cell types. Mathematical representations of these variables reveal how mitosis and differentiation respond to stress or impairment. For example, as mitotic index increases during infection, both neutrophil output and total WBC concentration rise significantly.
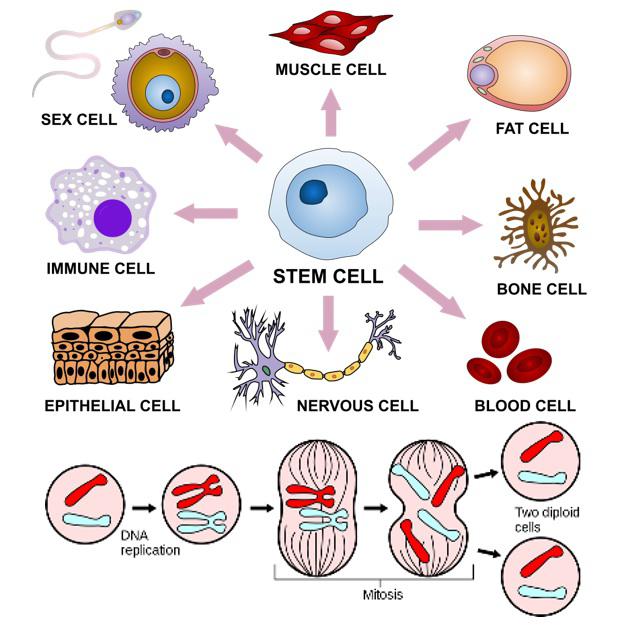
This illustrates the relationship between cellular division and the formation of specialized tissues. Mitosis ensures that enough precursors exist to meet physiological demand. Differentiation ensures that those precursors mature into blood cells with distinct structures and functions. Together, these processes allow organisms to maintain oxygen transport, immune function, and homeostasis.
Diagram 1.
 Source: https://app.formative.com/library/61a958eb33a0dee439a54193
Diagram 2.
 Source: https://www.dreamstime.com/stock-illustration-bone-marrow-blood-cells-infographic-diagram
Table 1.
Condition | Mitotic Index % | RBC Output Million/uL | WBC Output Thousand/uL |
|---|
Normal | 8 | 5.1 | 7 |
Mild Infection | 14 | 5.4 | 11.5 |
Severe Infection | 22 | 6 | 18.2 |
Anemia | 18 | 3.2 | 6.8 |
Bone Marrow Suppression | 3 | 2.1 | 2 |
Graph of Information - Figure 1.
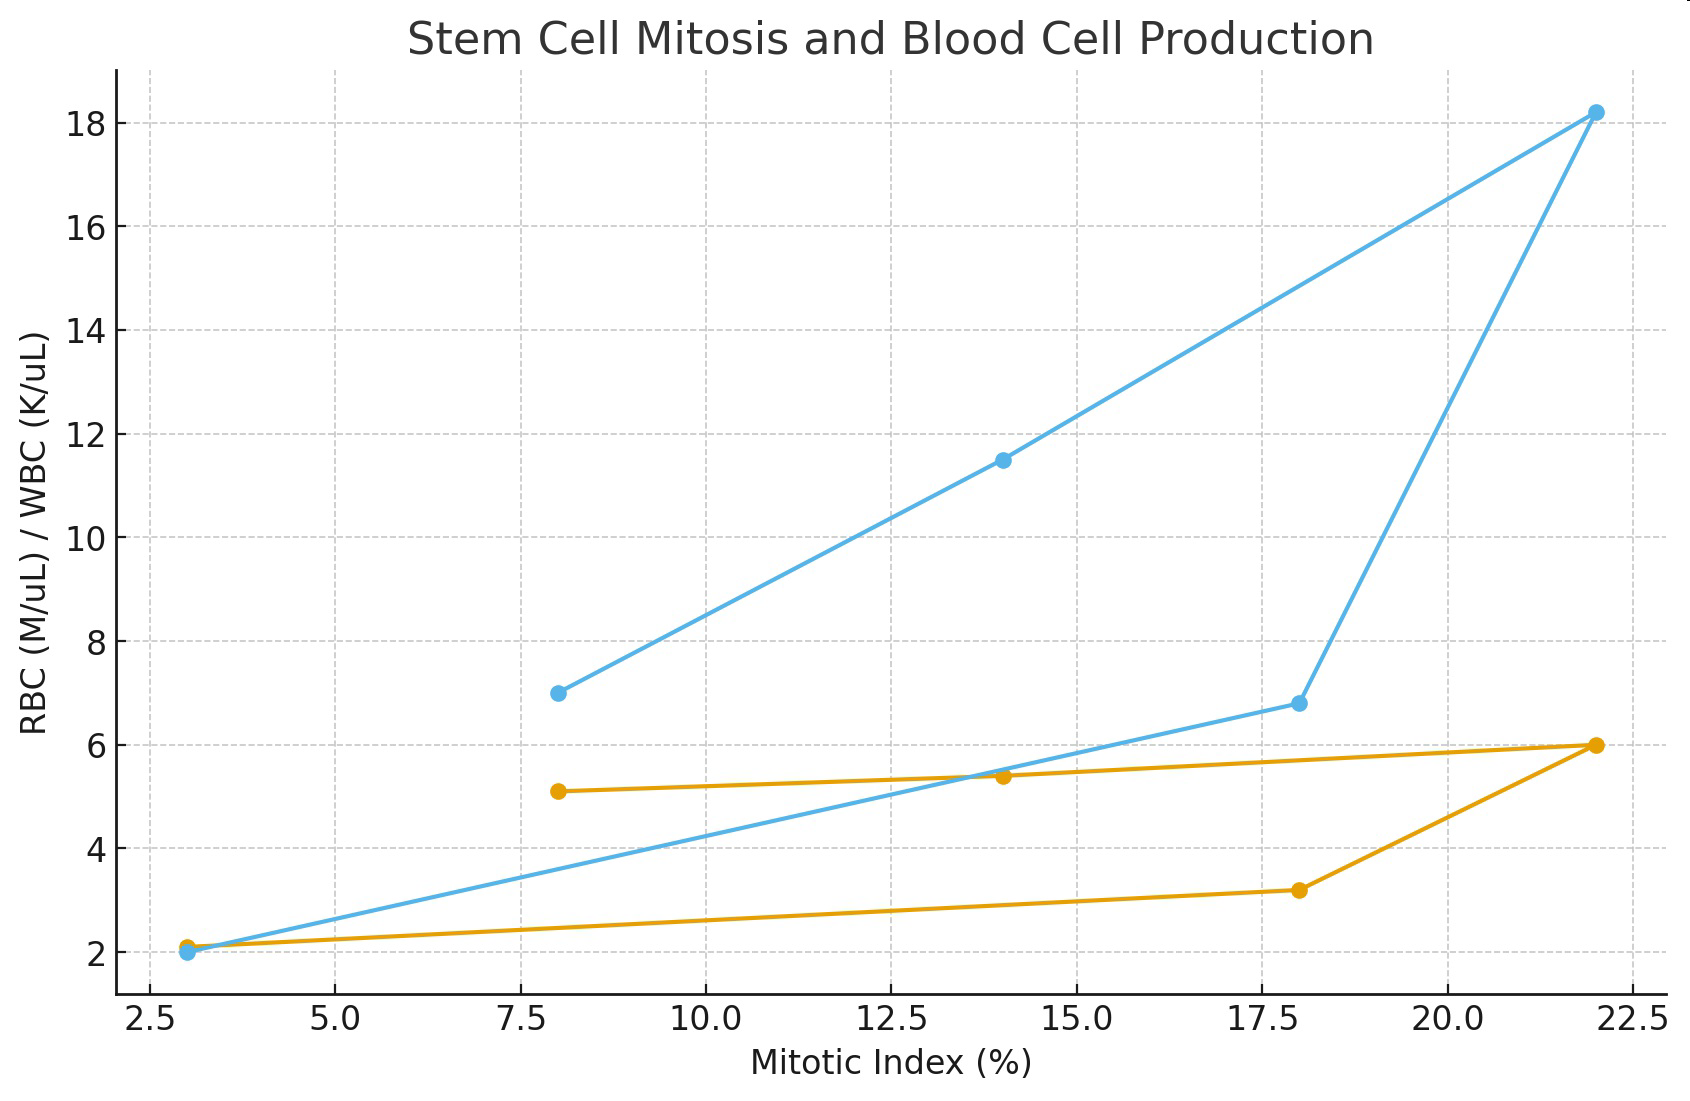
Table 2.
Condition | RBC % | Neutrophils % | Lymphocytes % | Platelets % |
|---|
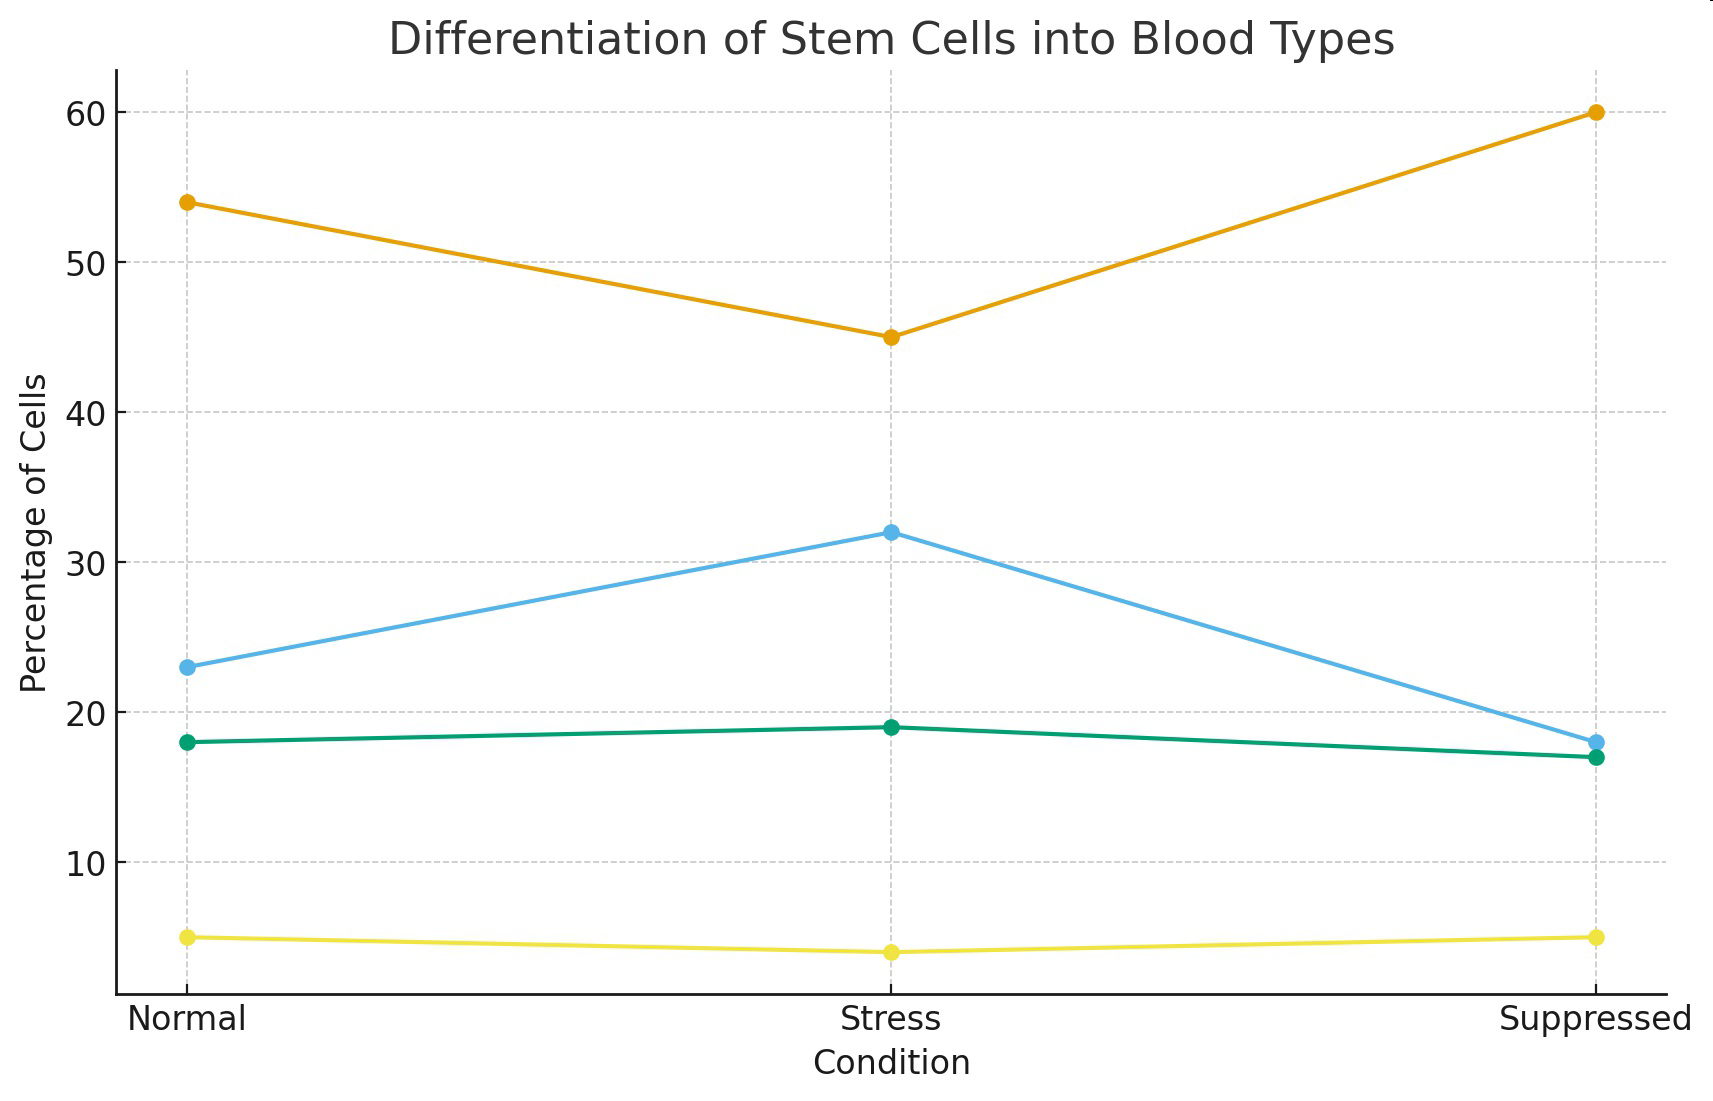
Normal | 54 | 23 | 18 | 5 |
Stress | 45 | 32 | 19 | 4 |
Suppressed | 60 | 18 | 17 | 5 |
Graph of Information - Figure 2.