Antibiotic Resistance
Antibiotic resistance in bacteria is one of the clearest and most measurable examples of evolution occurring in real time. When antibiotics are introduced into a population of bacteria, most cells may initially die, but some individuals survive due to genetic variations that make them less susceptible. These surviving bacteria pass their resistance traits to the next generation, causing the frequency of resistance genes in the population to increase. This shift in allele frequency is direct empirical evidence of evolution and supports the concept of common ancestry and descent with modification.
Multiple lines of evidence show how antibiotic resistance evolves. One major source of data comes from laboratory experiments in which scientists grow bacteria through many generations under controlled conditions. When exposed to an antibiotic such as ampicillin, populations rapidly shift from mostly sensitive cells to mostly resistant cells. By tracking population size and resistance frequency across generations, researchers can observe evolutionary change quantitatively.
Diagram 1.
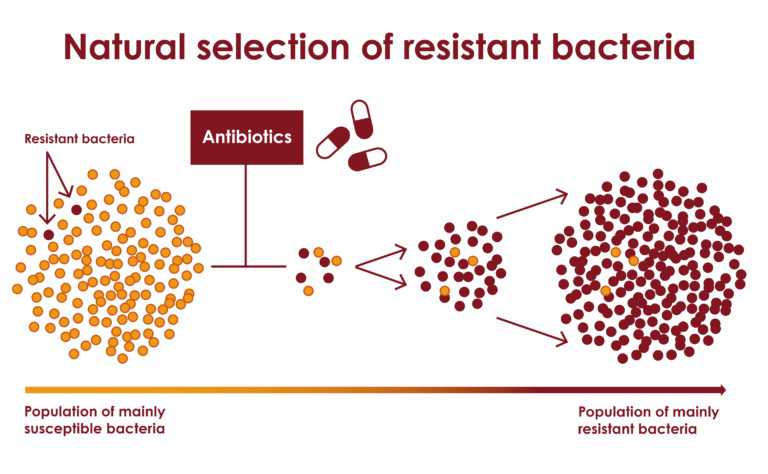 Source: https://www.reactgroup.org/toolbox/understand/antibiotic-resistance/mutation-and-selection/
Genetic evidence provides another important line of support. Resistant strains often possess specific mutations - such as changes in genes coding for cell-wall synthesis enzymes or proteins targeted by antibiotics. DNA sequencing shows that these mutations increase in frequency over successive generations, demonstrating heritable variation. Additionally, resistant strains can acquire new genes through horizontal gene transfer, further supporting the idea that organisms share genetic material and inherit modifications over time.
A third line of evidence comes from phylogenetic analysis. When scientists compare DNA sequences among resistant and non-resistant bacterial strains, they can construct evolutionary trees that show how different lineages emerged. Resistant strains cluster together on phylogenetic trees, indicating that they share a recent common ancestor and inherited the resistance trait through descent.
Environmental data also support evolutionary explanations. In hospitals and agricultural settings where antibiotic use is high, resistant populations increase rapidly. In contrast, in areas with reduced antibiotic usage, resistance levels often decline because non-resistant strains reproduce more efficiently in the absence of antibiotics.
Diagram 2.
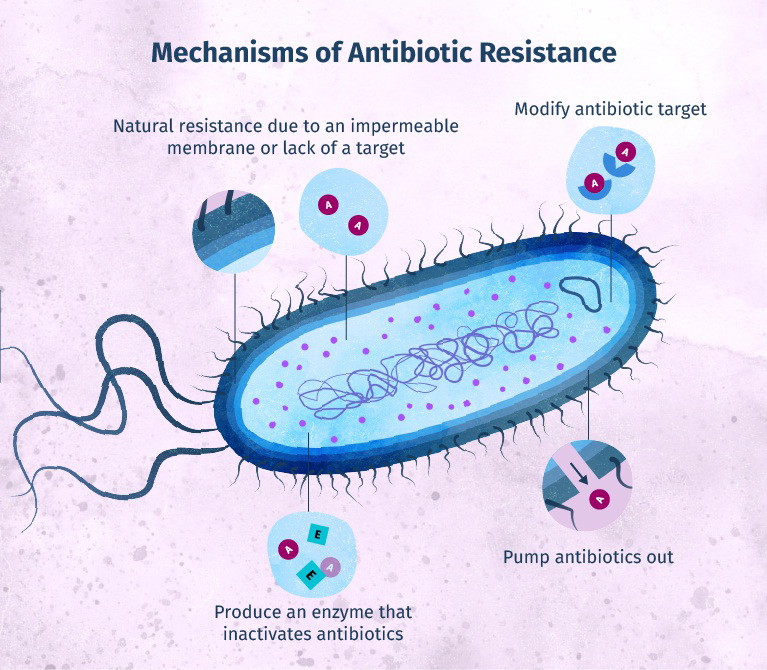
Source: https://onlinepublichealth.gwu.edu/resources/antibiotic-resistance-at-cellular-level/
Table 1.
Generation | Resistant Phenotype Frequency (%) | Generation | Resistant Phenotype Frequency (%) |
|---|
1 | 5 | 6 | 45 |
2 | 8 | 7 | 60 |
3 | 12 | 8 | 72 |
4 | 20 | 9 | 80 |
5 | 30 | 10 | 88 |
Graph of Information - Figure 1.
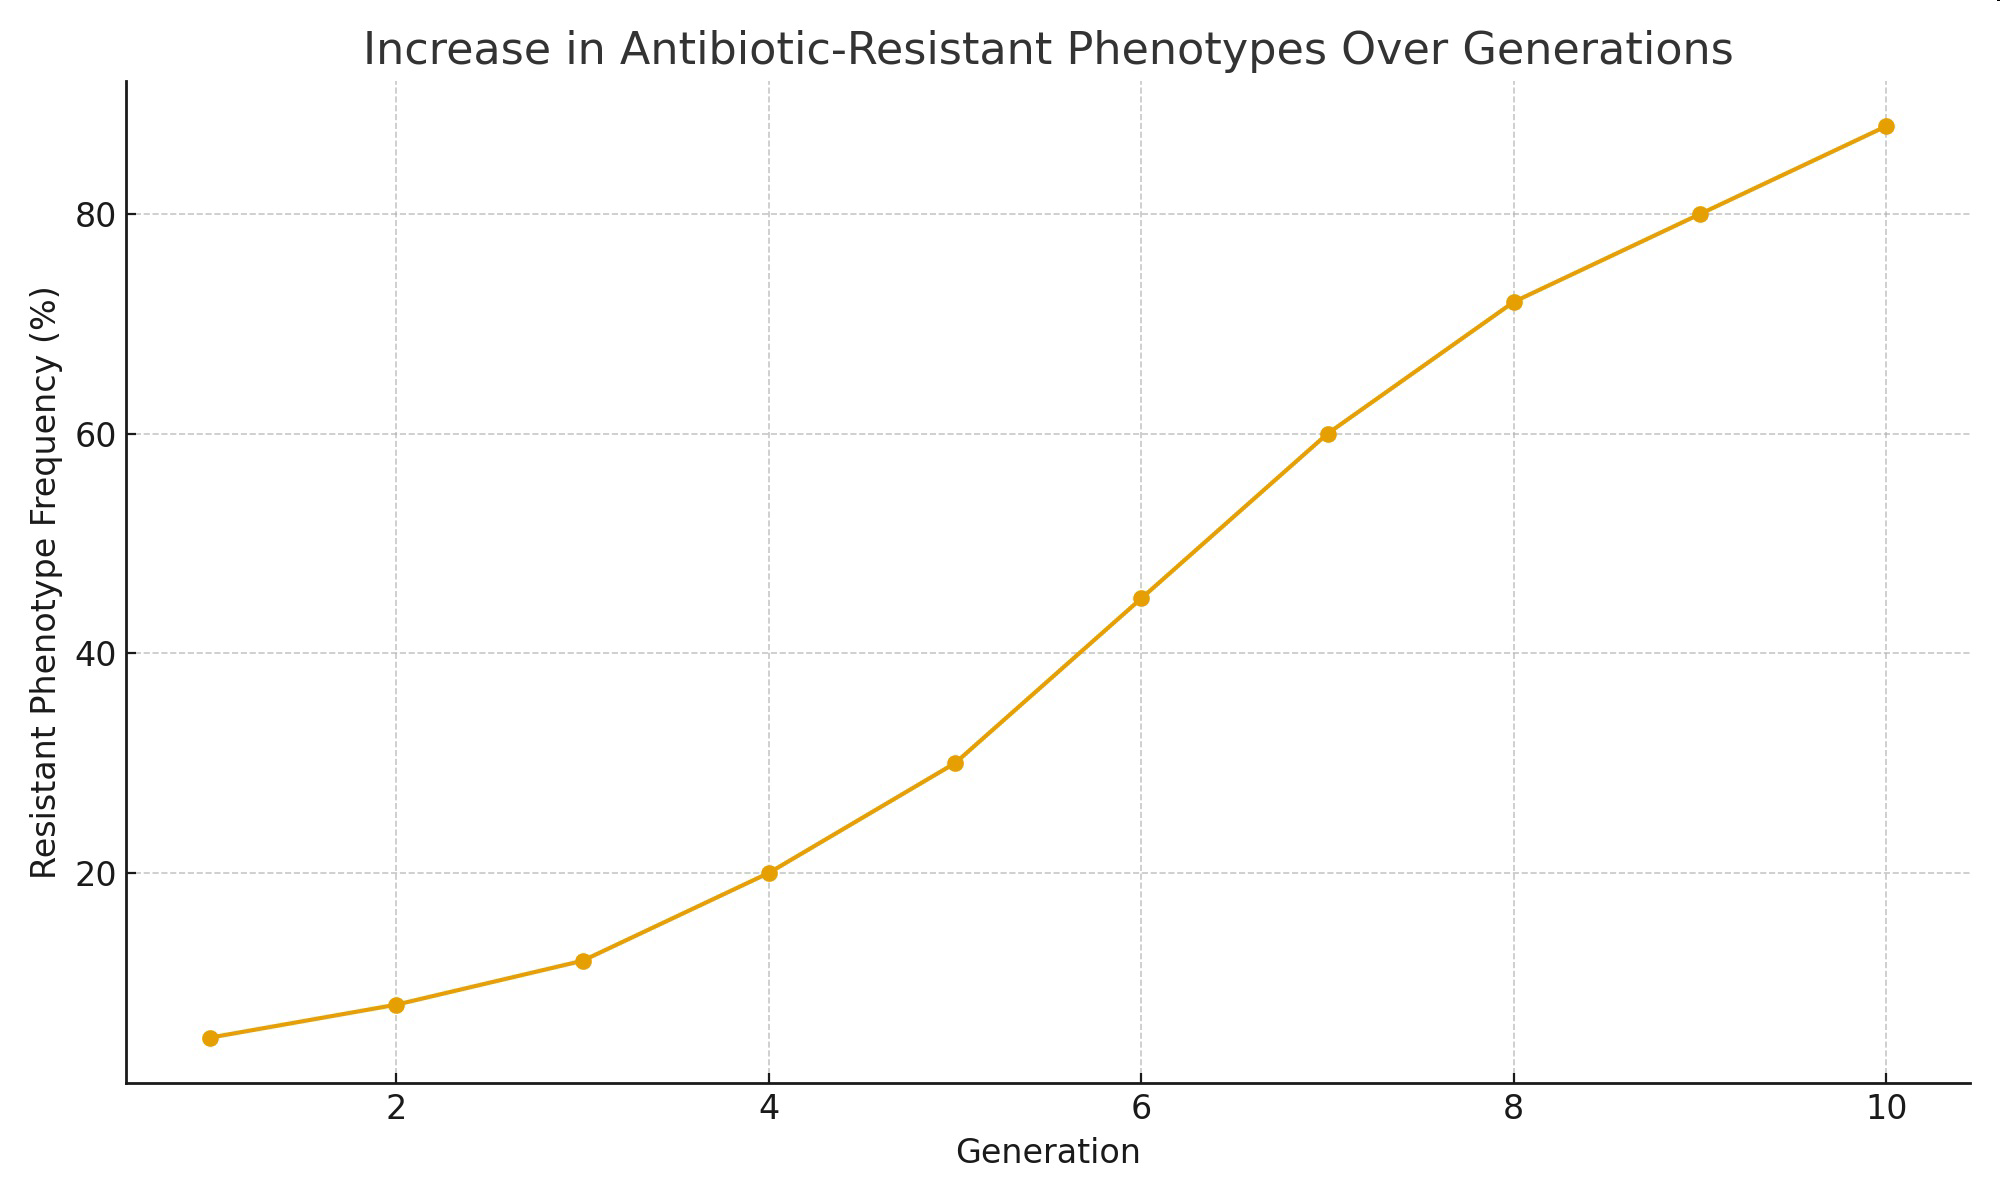
Table 2.
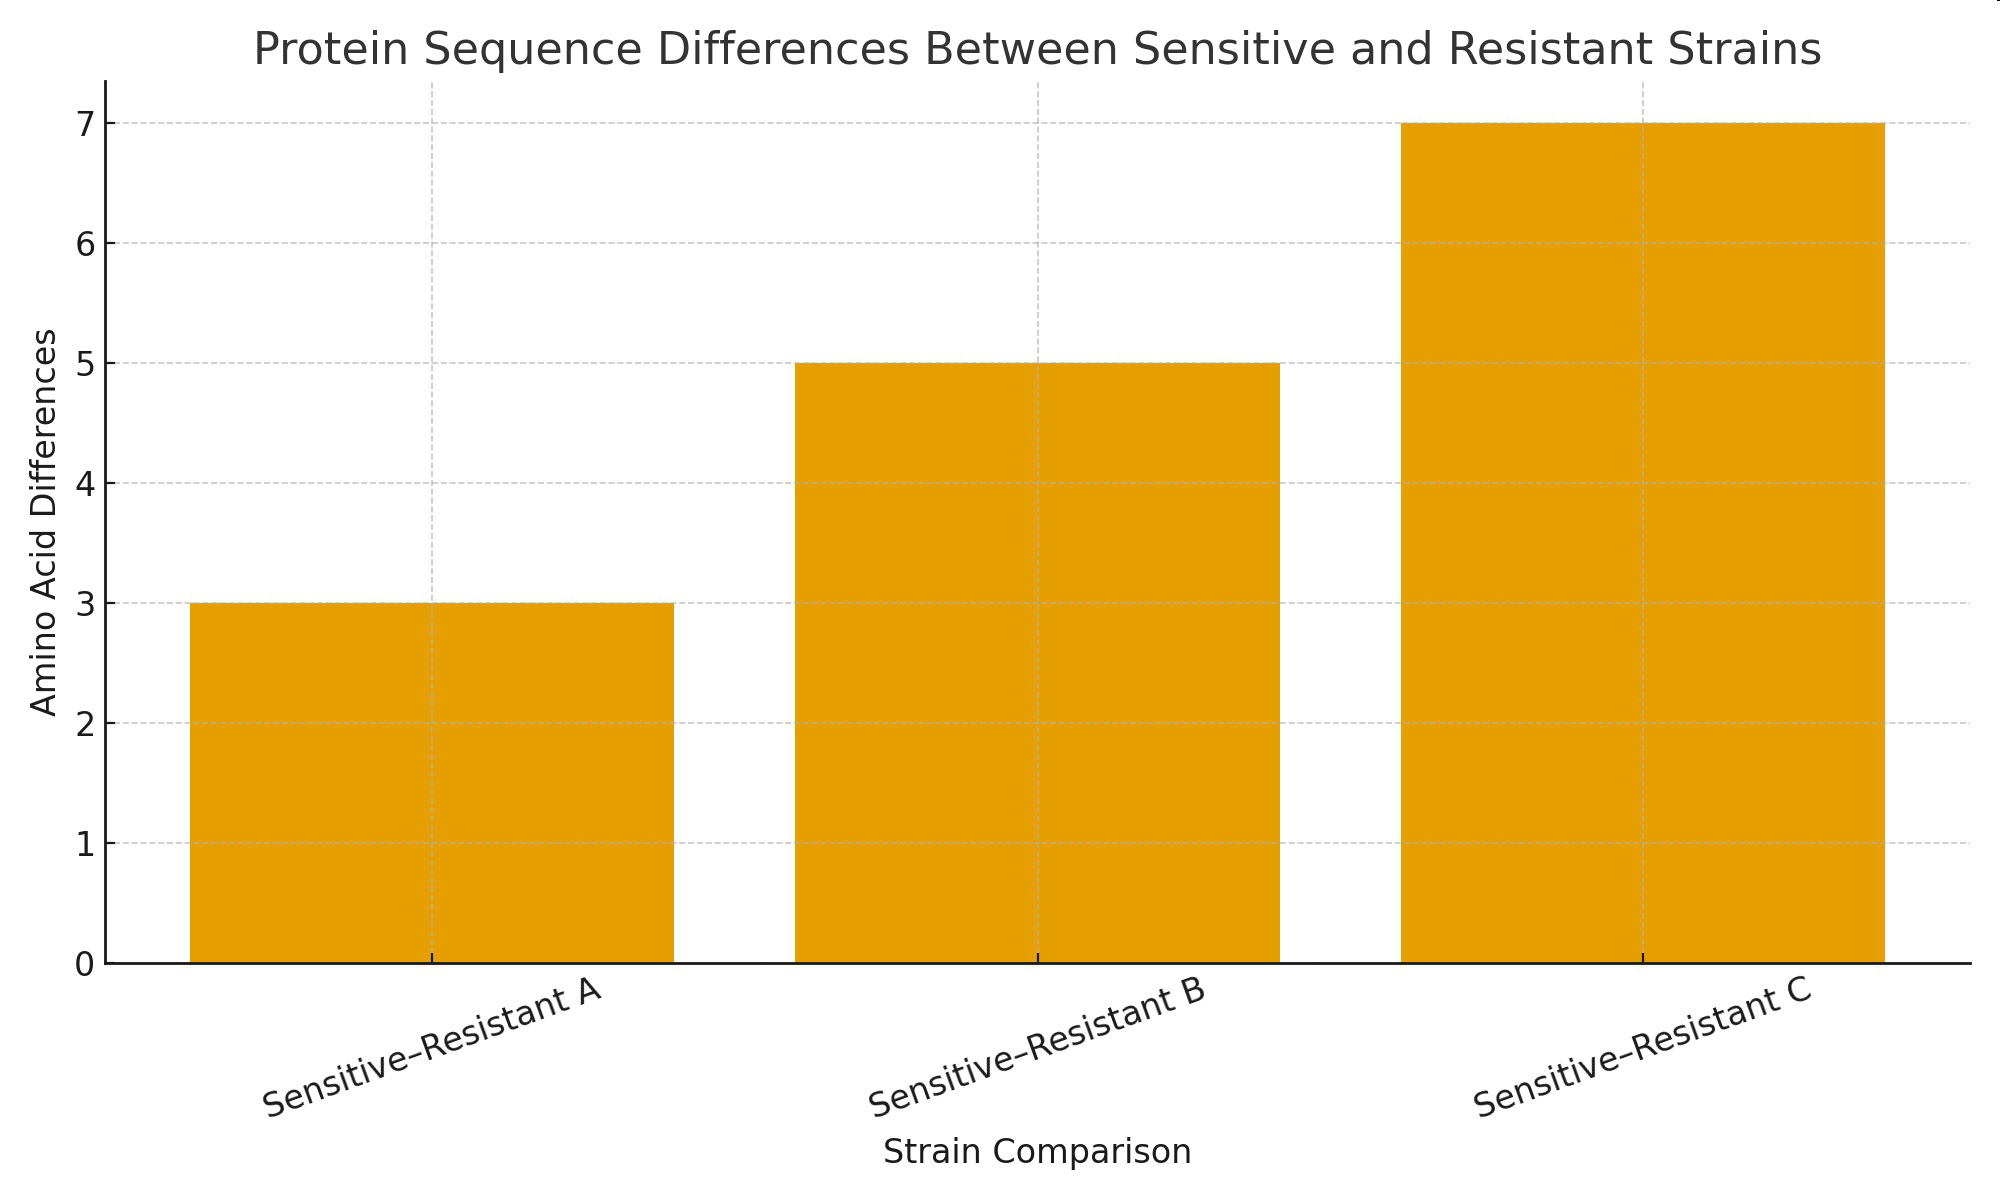
Comparison | Amino Acid Differences |
|---|
Sensitive to Resistant A | 3 |
Sensitive to Resistant B | 5 |
Sensitive to Resistant C | 7 |
Graph of Information - Figure 2.