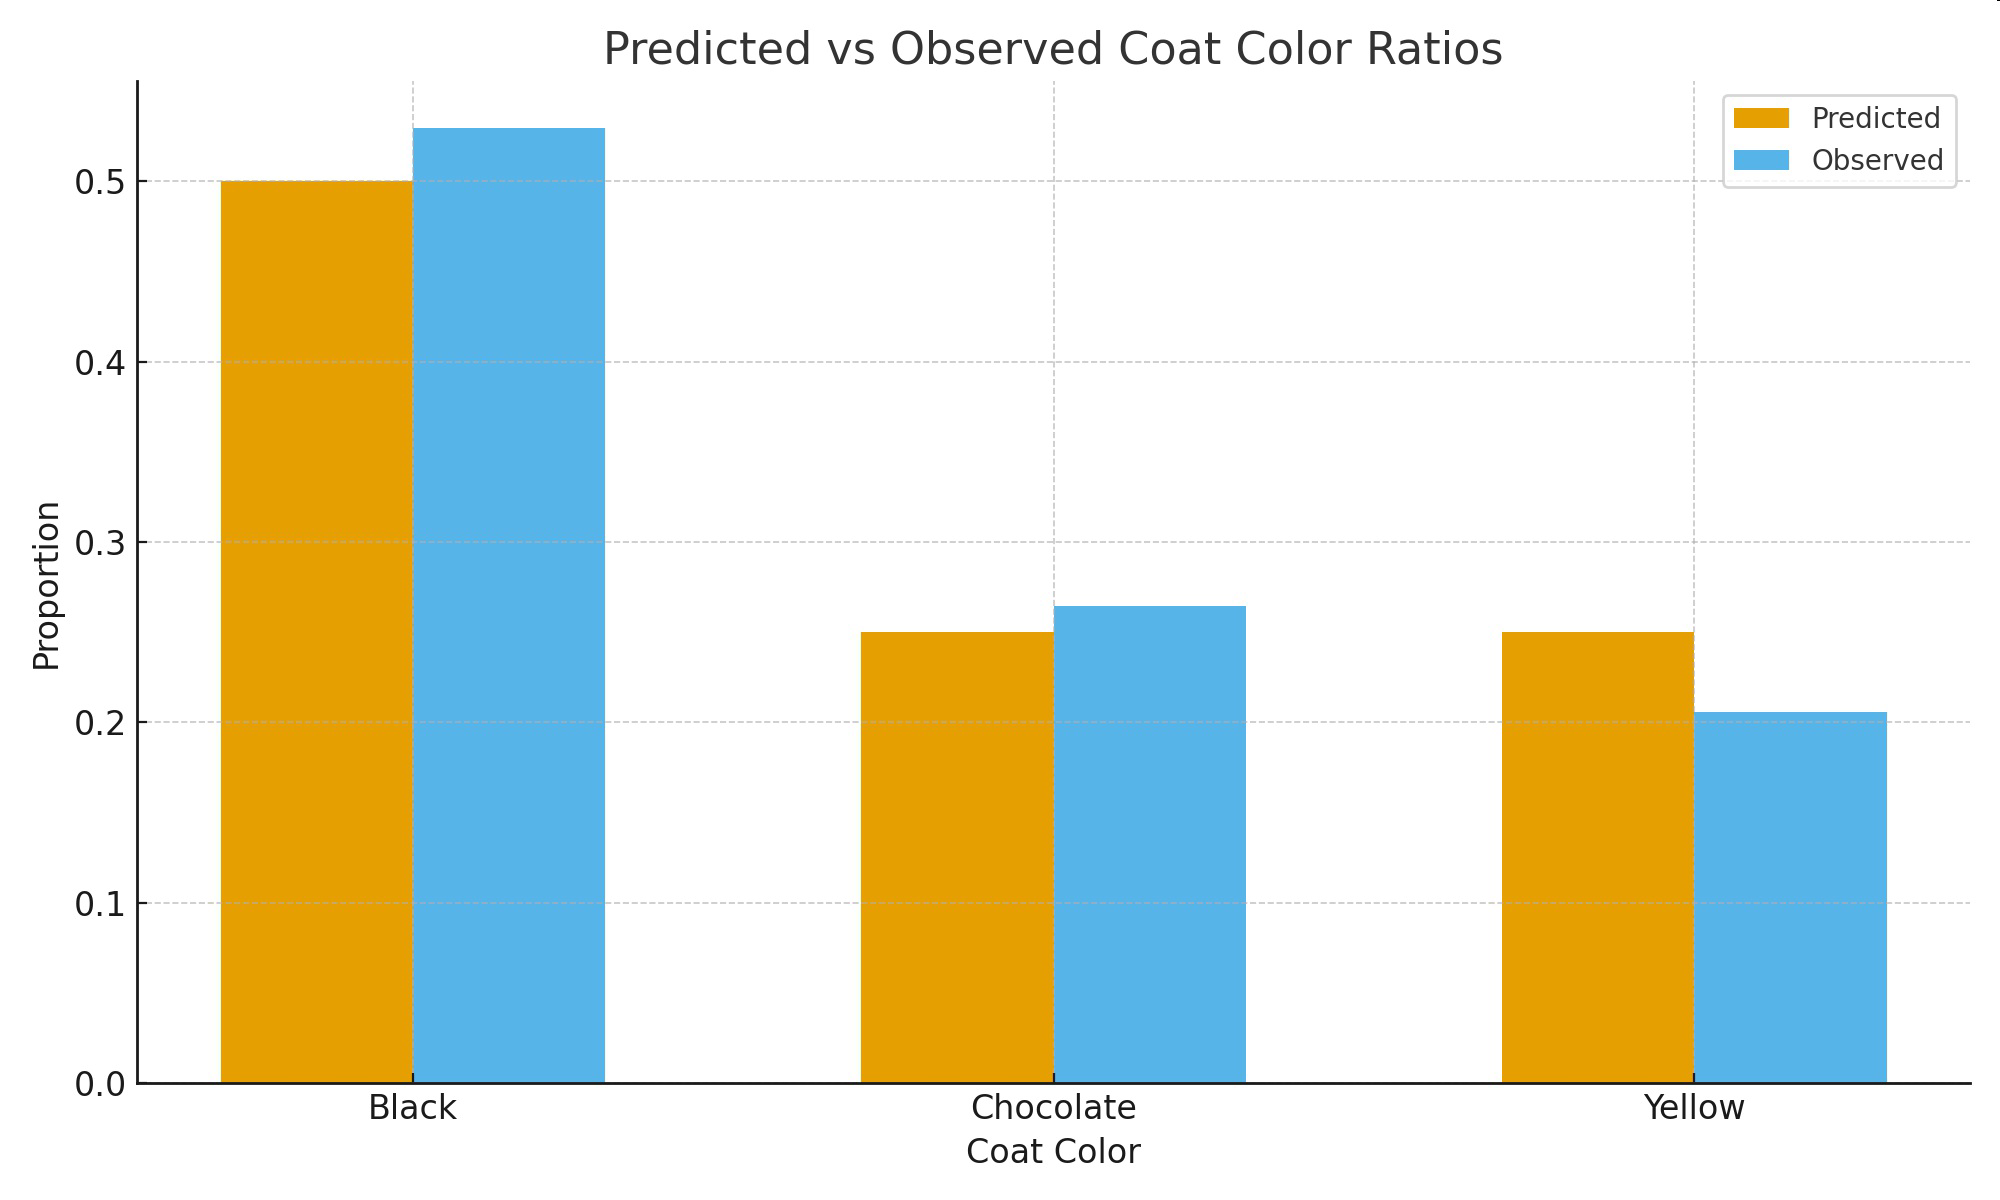
Coat Color Inheritance in Labrador Retrievers
Labrador retrievers are a classic example used to study how DNA and chromosomes code for characteristic traits. Most people recognize three common coat colors in Labs: black, chocolate (brown), and yellow. These visible differences arise from specific DNA sequences in genes that influence pigment production. By examining these genes and their locations on chromosomes, scientists can connect molecular information in DNA to the traits passed from parents to offspring.
Two key genes contribute to Labrador coat color: MC1R (often called the “E” locus) and TYRP1 (often called the “B” locus). The MC1R gene helps control whether dark pigment (eumelanin) is produced in the fur. When the dominant allele E is present, eumelanin can be deposited, allowing black or brown coats to appear. However, dogs that inherit two copies of the recessive allele e (genotype $ee$) do not deposit eumelanin in their fur, resulting in a yellow coat, regardless of what alleles they carry at other pigment genes.
Diagram 1.
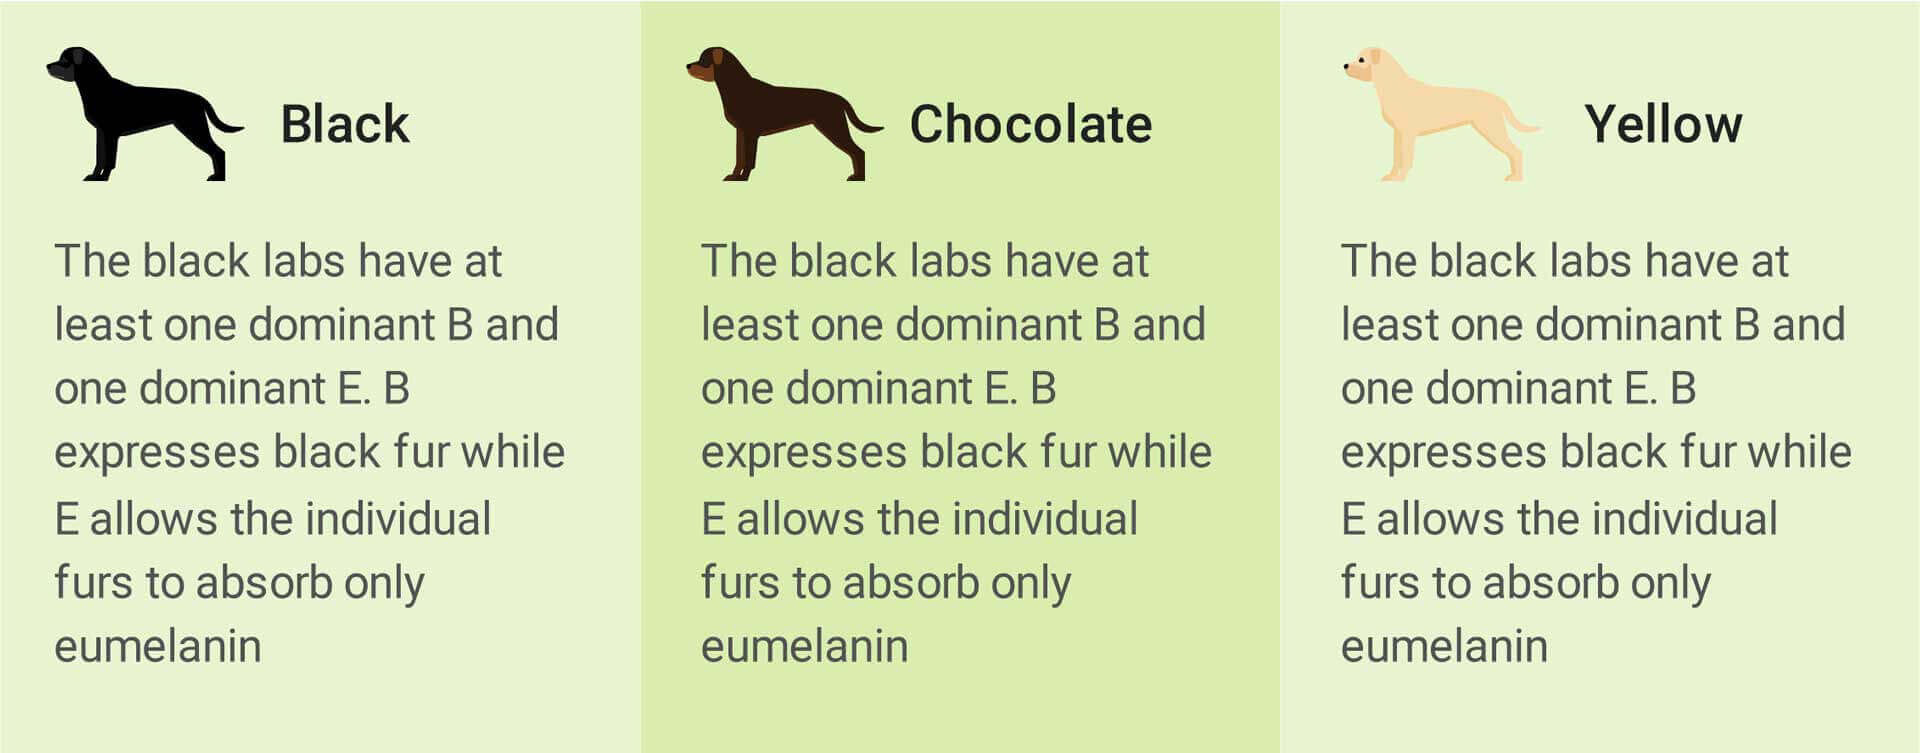 Source: https://www.snowypineswhitelabs.com/guides/does-a-labs-coat-color-matter/
The TYRP1 gene influences whether the eumelanin pigment appears as black or brown. Dogs with at least one dominant B allele can produce black pigment. Dogs that inherit two recessive b alleles (genotype $bb$) convert black pigment to brown, producing chocolate Labs. These genes are located on specific chromosomes, and each parent passes one copy of each gene to its offspring through their gametes.
The combination of alleles at both loci determines the dog’s coat color. For example, a dog with genotype $E_B_$ (at least one E and one B) will be black. A dog with $E_bb$ will be chocolate, and a dog with $ee__$ will be yellow, regardless of B or b. When breeders track pedigrees and genotypes, they can predict the probability of each coat color in a litter.
Diagram 2.
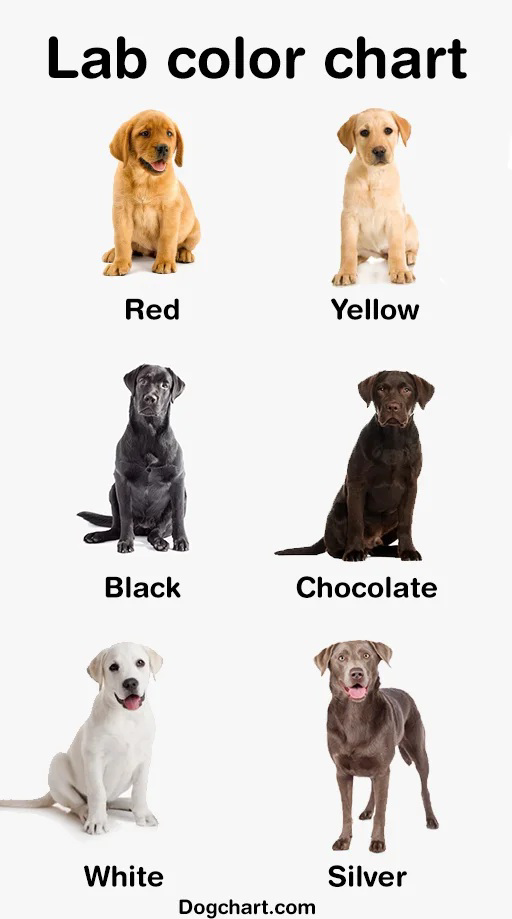
Source:
https://dogchart.com/labrador-retriever-color-chart.html
This system demonstrates how DNA sequences – organized into genes on chromosomes – encode information for specific traits. It also shows how interactions between genes (epistasis) change the resulting phenotype. By asking questions about which alleles are present, how they interact, and how they are inherited, students can clarify the relationships between DNA, chromosomes, and observable characteristics in offspring.
Table 1.
MC1R Genotype (E/e) | TYRP1 Genotype (B/b) | Predicted Coat Color |
|---|
EE | BB | Black |
Ee | Bb | Black |
ee | BB | Yellow |
EE | bb | Chocolate |
Ee | bb | Chocolate |
ee | Bb | Yellow |
Graph of Information - Figure 1.
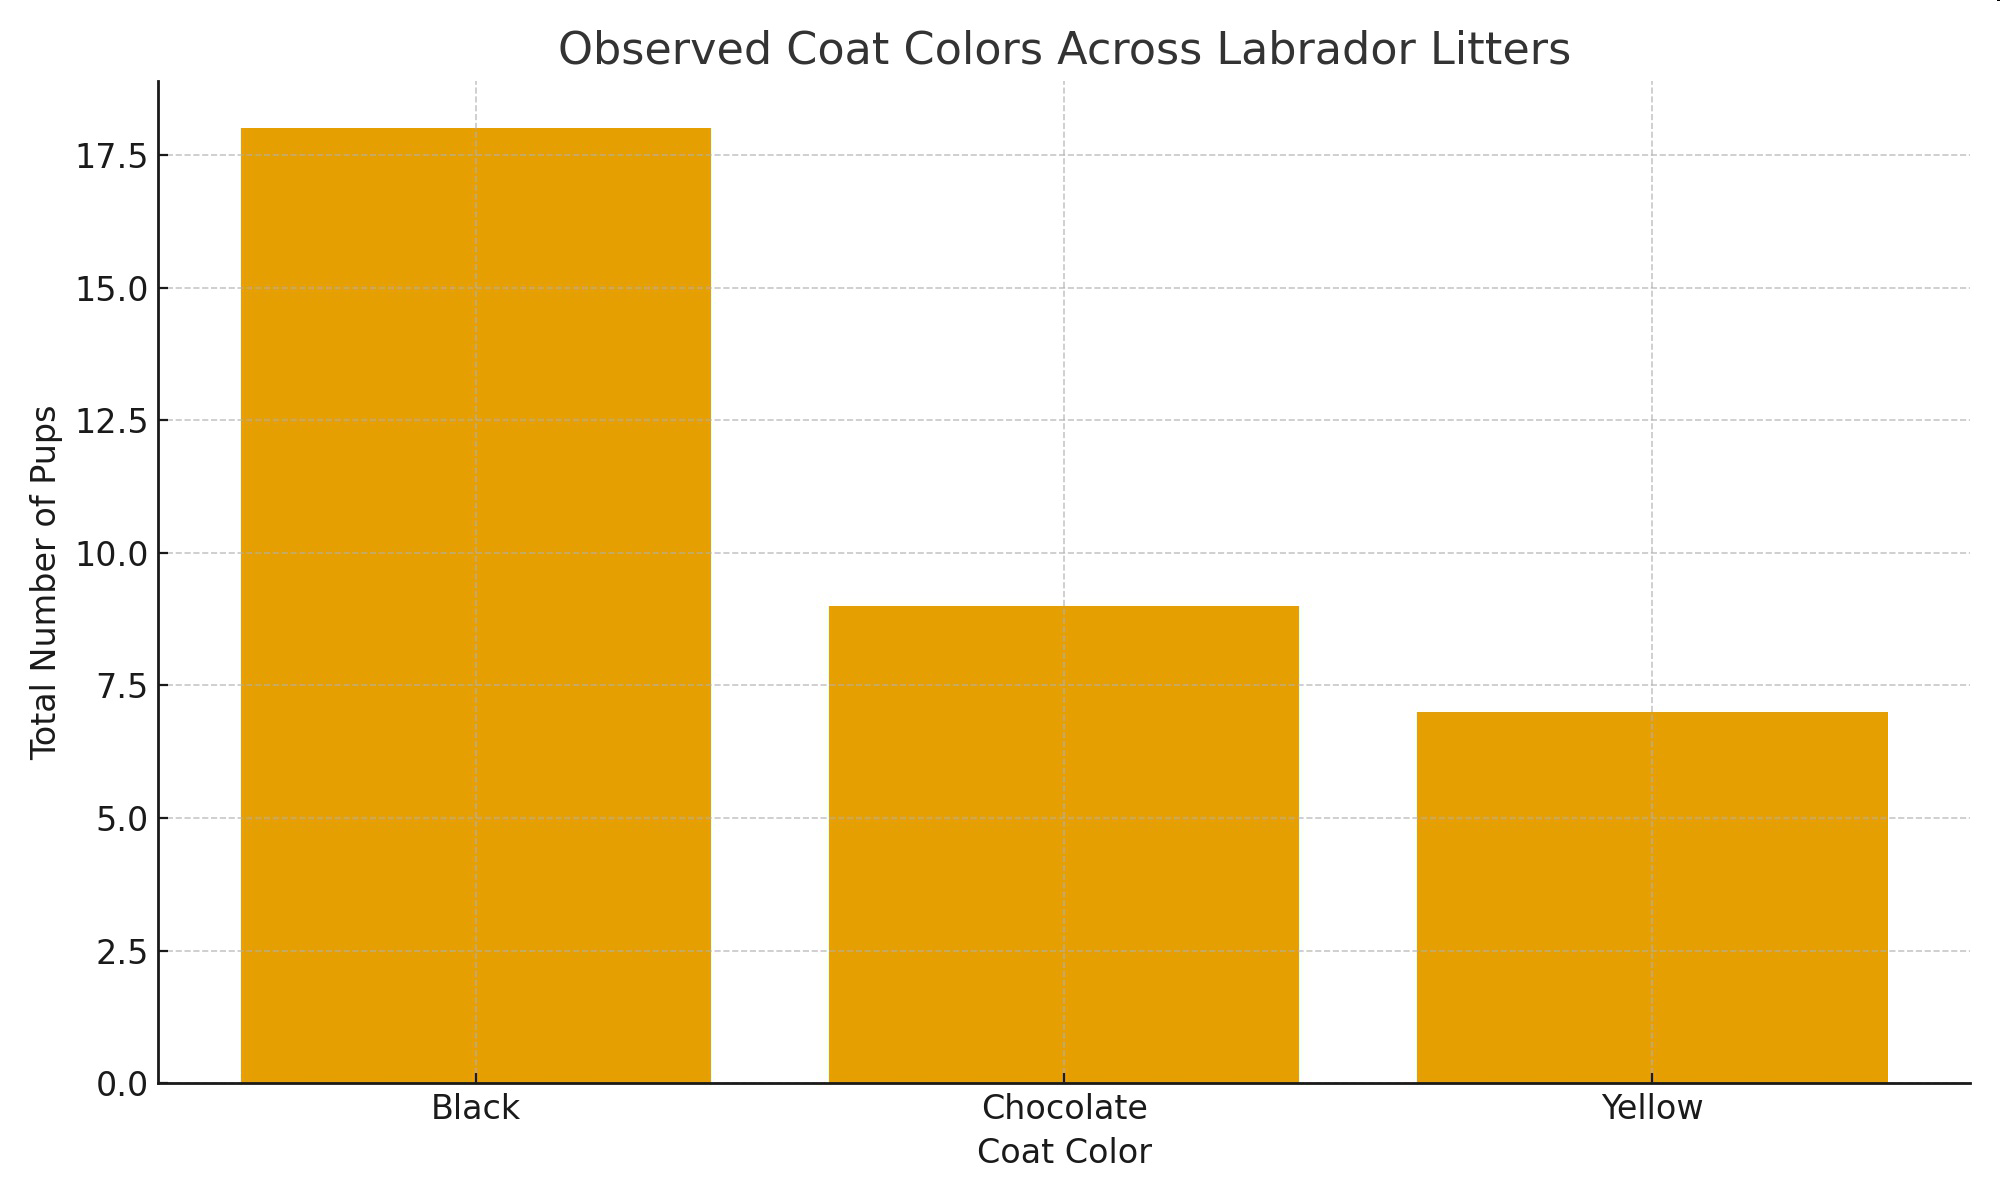
Table 2.
Litter ID | Number Black Pups | Number Chocolate Pups | Number Yellow Pups |
|---|
L1 | 4 | 2 | 1 |
L2 | 3 | 1 | 2 |
L3 | 5 | 1 | 2 |
L4 | 2 | 3 | 1 |
L5 | 4 | 2 | 1 |
Graph of Information - Figure 2.