Salamander Limb Regeneration
Among all vertebrates, salamanders possess one of the most extraordinary regenerative abilities. When a salamander loses a limb due to injury or predation, it can fully regrow the lost structure - including bone, muscle, nerves, blood vessels, and skin. This remarkable process involves a tightly coordinated sequence of mitosis, dedifferentiation, and differentiation.
Regeneration begins immediately after limb loss. Blood vessels constrict and a wound epidermis quickly covers the injury site. Beneath this wound covering, cells undergo dedifferentiation, reverting from their specialized forms back into a more stem-cell-like state. For example, muscle fibers break down into mononucleated precursor cells, and cartilage cells loosen their structure to become more flexible. These dedifferentiated cells form a mass of proliferating cells called a blastema - the core engine of regeneration.
Inside the blastema, mitosis accelerates dramatically, producing a high number of unspecialized cells. Scientists often measure this through mitotic index markers, which show regeneration hotspots with exceptionally high cell-division rates compared to normal tissue. Over time, gradients of signaling molecules guide these dividing cells into specific differentiation pathways, recreating the structural organization of the limb. Cells at deeper regions form bone and muscle; cells near the surface form skin; and specialized nerves grow back, restoring function.
Environmental factors such as temperature, nutrition, and salamander age strongly influence regeneration speed. Younger salamanders generally regenerate limbs faster because they have higher baseline mitotic activity. Similarly, regeneration slows in colder temperatures because mitosis decreases.
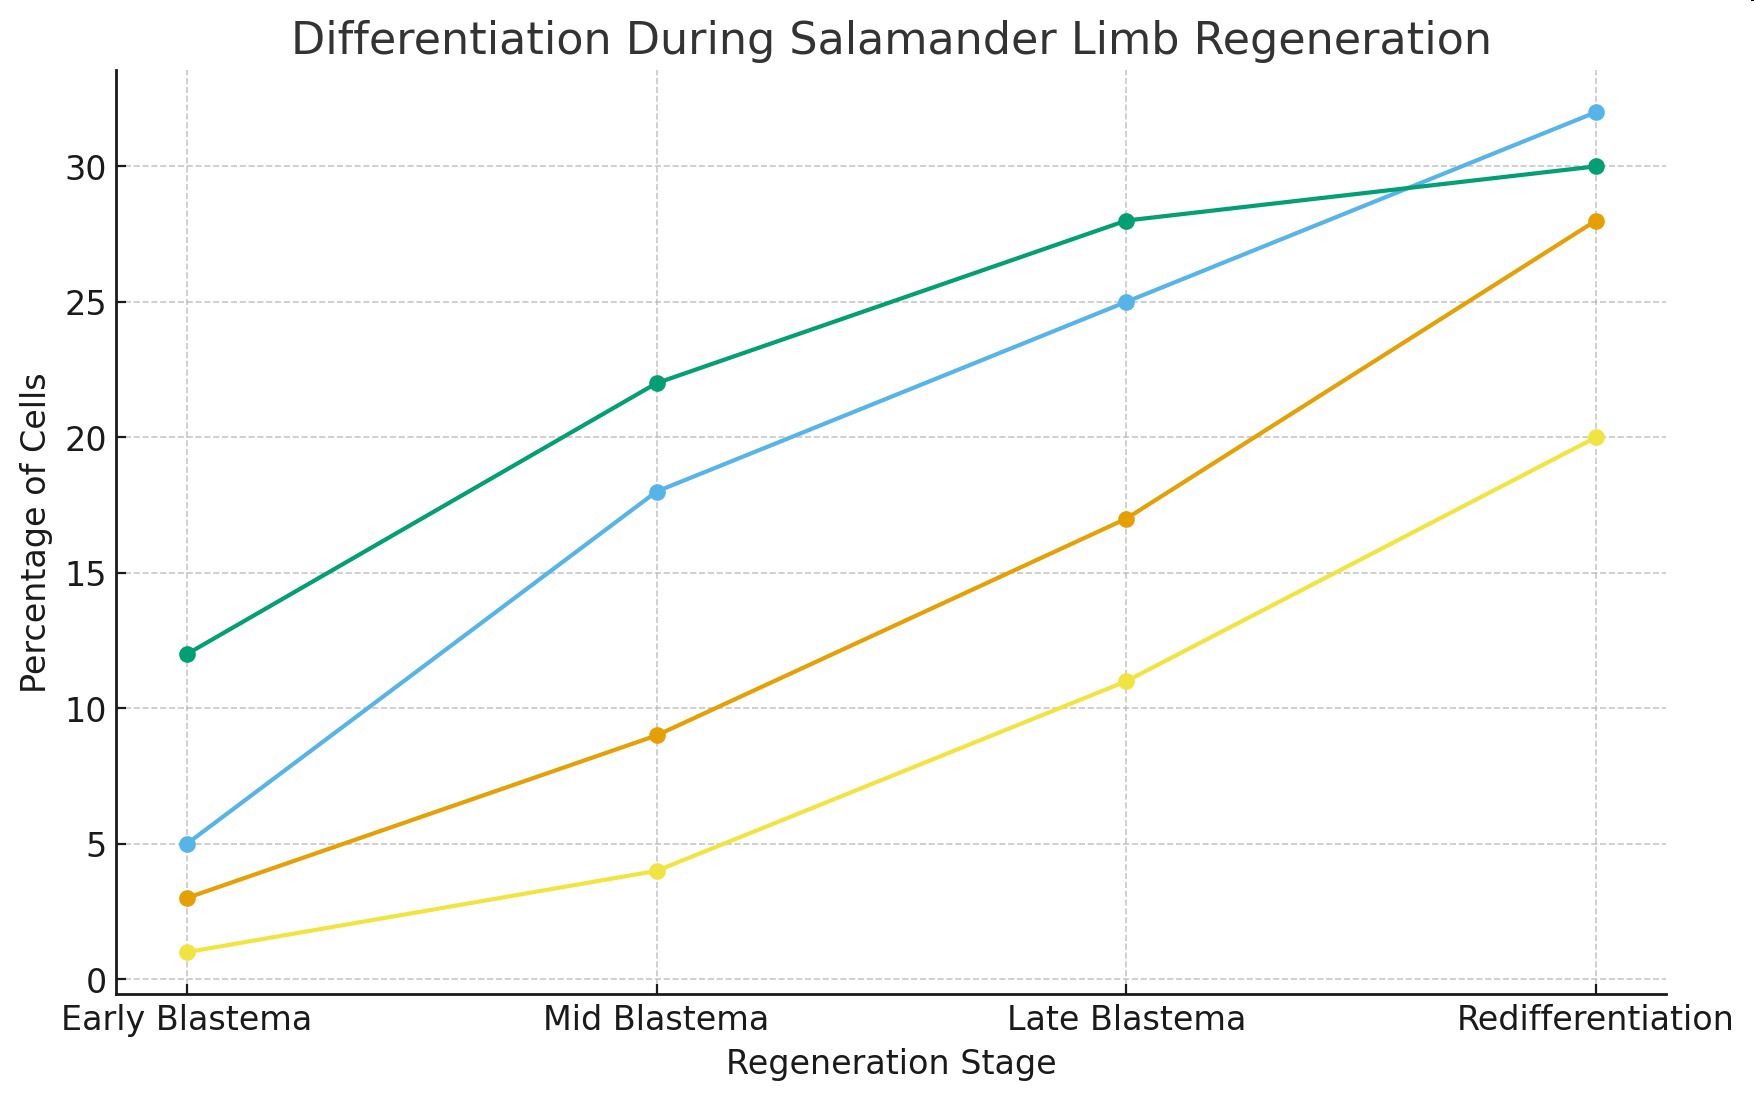
Researchers study salamander regeneration using data such as blastema size, mitotic index, regeneration length over time, and proportions of cell types at different regeneration stages. These data allow scientists to build computational and mathematical models that predict regeneration outcomes under different conditions.
Diagram 1.
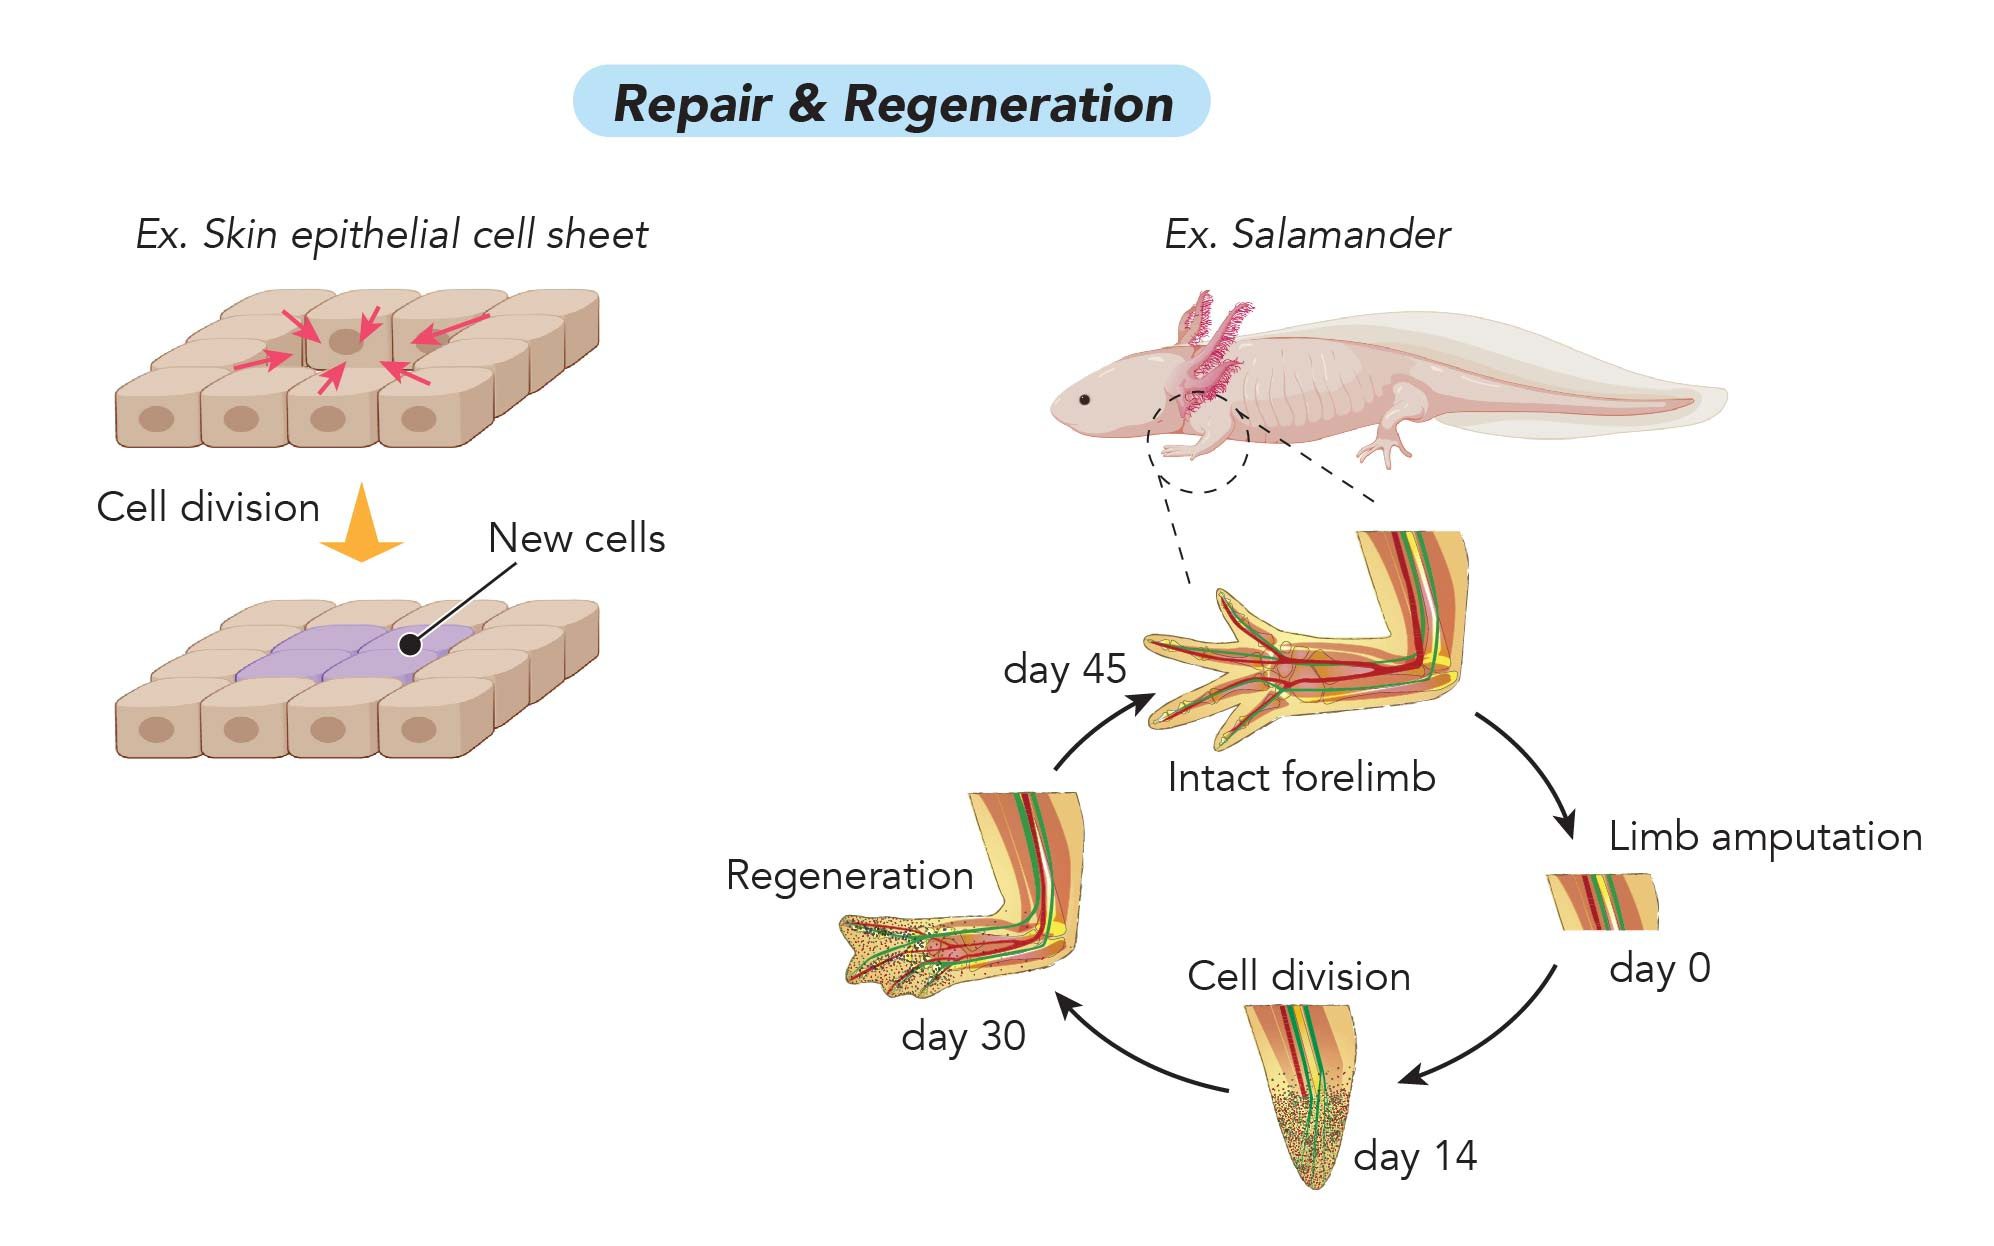 Source:
https://rsscience.com/why-cell-division-is-important/
Diagram 2.
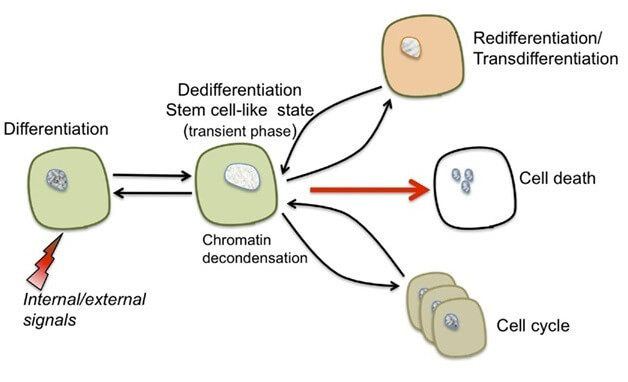 Source: https://www.phdnest.com/differentiation-dedifferentiation-and-redifferentiation-example/
Table 1.
Days After Amputation | Mitotic Index % | Regenerated Length mm |
|---|
5 | 15 | 2 |
10 | 24 | 5 |
20 | 31 | 11 |
30 | 22 | 17 |
45 | 10 | 21 |
Graph of Information - Figure 1.
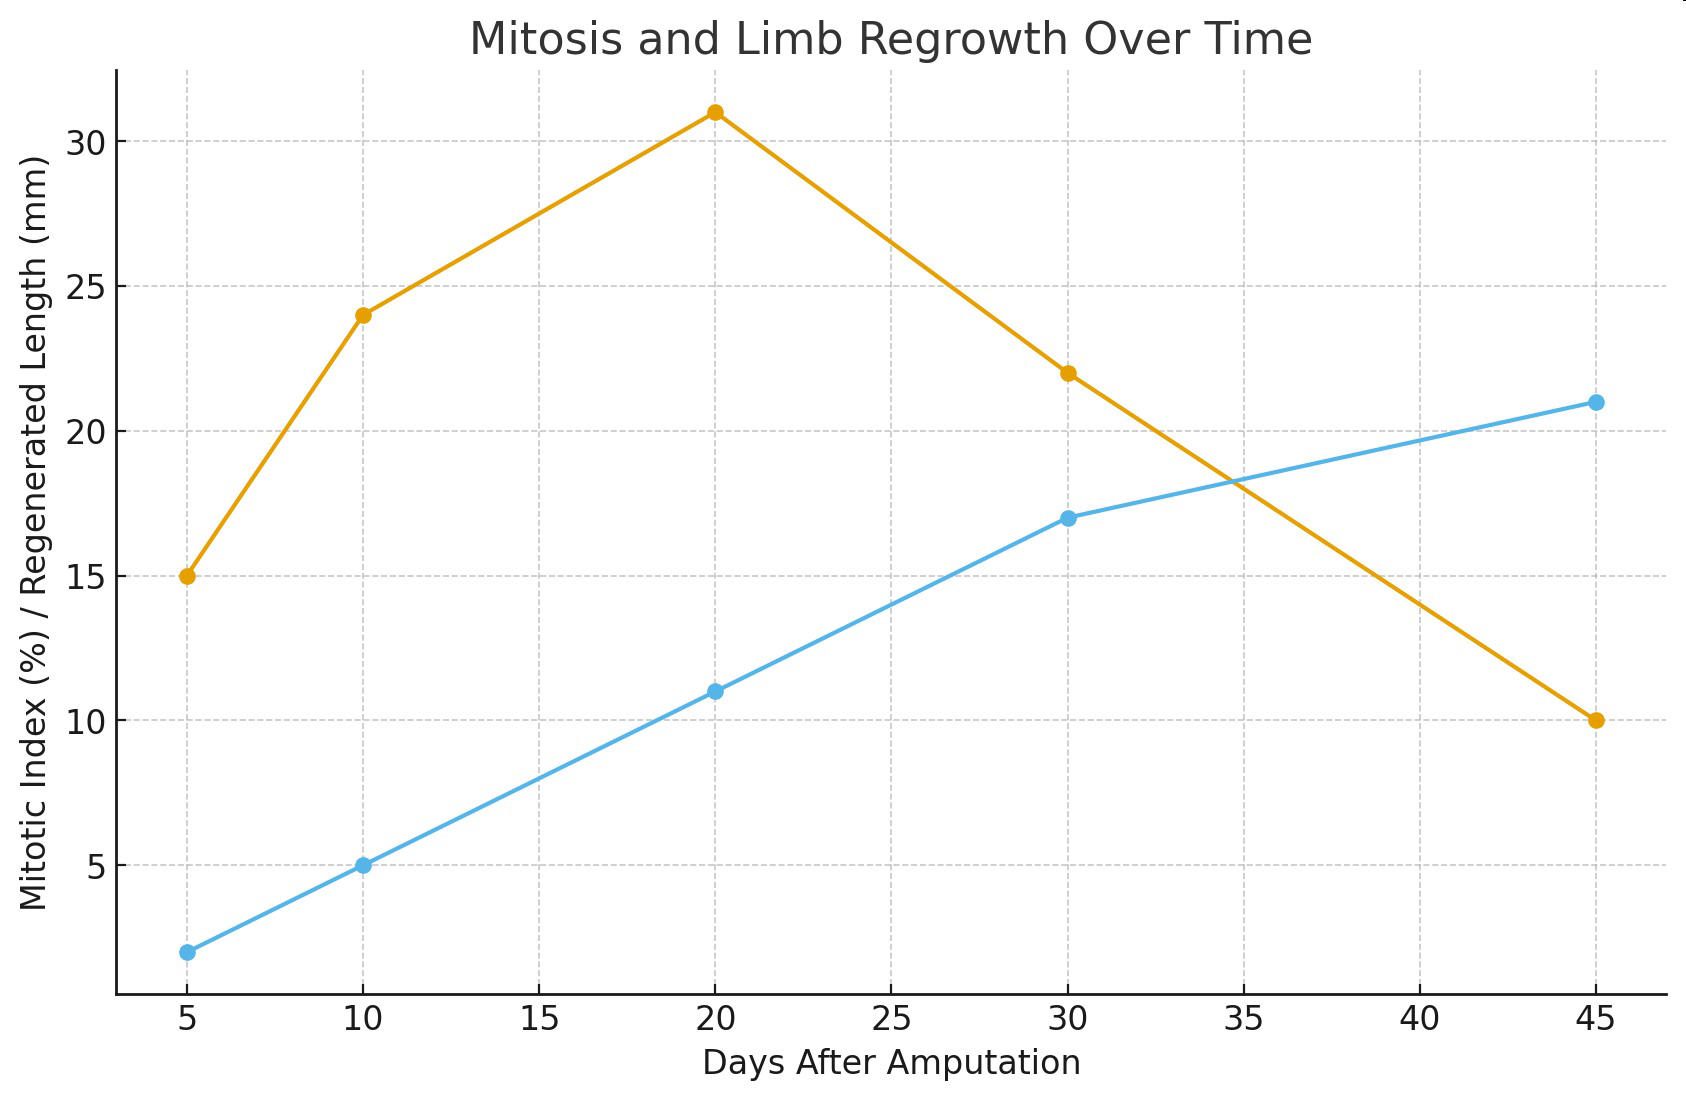
Table 2.
Regeneration Stage | Bone Cells % | Muscle Cells % | Skin Cells % | Nerve Cells % |
Early Blastema | 3 | 5 | 12 | 1 |
Mid Blastema | 9 | 18 | 22 | 4 |
Late Blastema | 17 | 25 | 28 | 11 |
Redifferentiation | 28 | 32 | 30 | 20 |
Graph of Information - Figure 2.