Twa kɔ nsɛm atitiriw so
Log in
Sign up for FREE
arrow_back
Laabri

Wildlife Corridors Reducing Habitat Fragmentation for Large Mammals - HS - BIOLOGY - Interdependent Relationships

star
star
star
star
star
Last updated 2 months ago
6 Nsɛmmisa
Hyɛ no nsow a efi ɔkyerɛwfo no hɔ:

Directions: Use the information provided and your knowledge of Life Science to answer the following questions. Show all work where necessary.

Directions: Use the information provided and your knowledge of Life Science to answer the following questions. Show all work where necessary.

Wildlife Corridors Reducing Habitat Fragmentation for Large Mammals

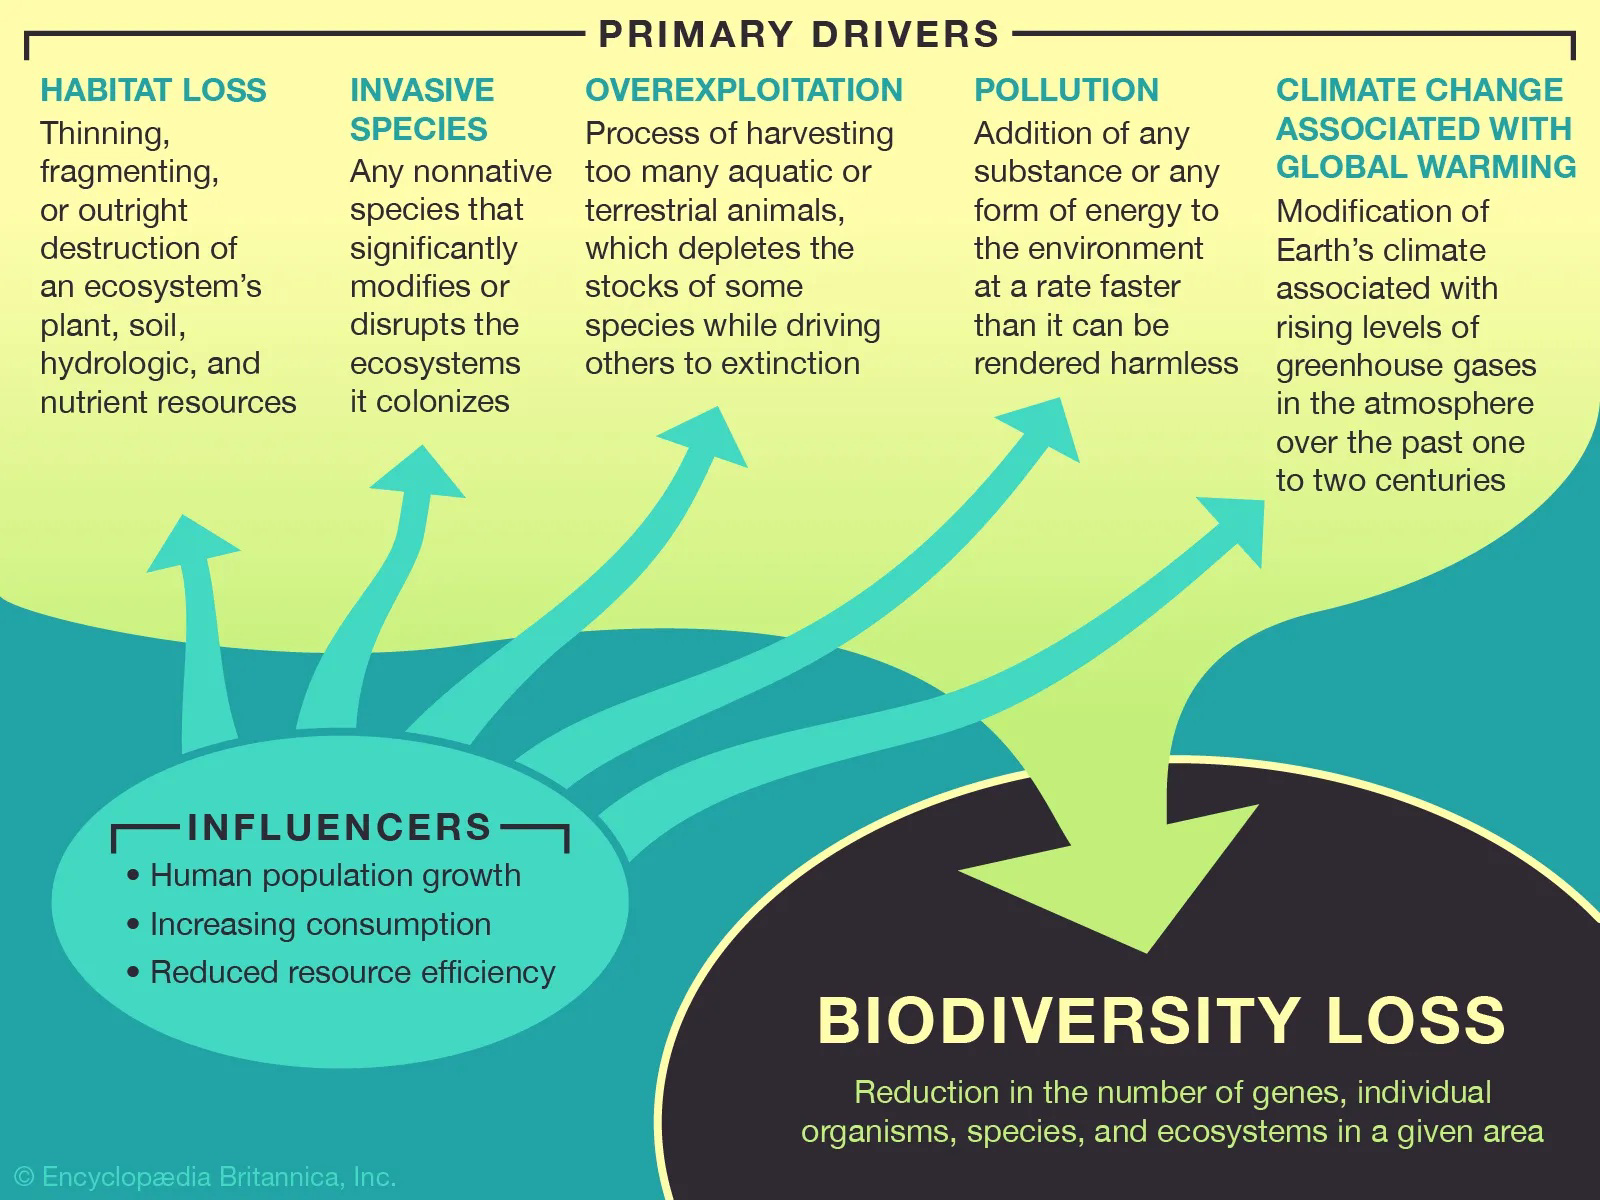
Diagram 1.

Diagram showing primary drivers and influencers leading to biodiversity loss

PRIMARY DRIVERS

HABITAT LOSS: Thinning, fragmenting, or outright destruction of an ecosystem’s plant, soil, hydrologic, and nutrient resources.

INVASIVE SPECIES: Any nonnative species that significantly modifies or disrupts the ecosystems it colonizes.

OVEREXPLOITATION: Process of harvesting too many aquatic or terrestrial animals, which depletes the stocks of some species while driving others to extinction.

POLLUTION: Addition of any substance or any form of energy to the environment at a rate faster than it can be rendered harmless.

CLIMATE CHANGE ASSOCIATED WITH GLOBAL WARMING: Modification of Earth’s climate associated with rising levels of greenhouse gases in the atmosphere over the past one to two centuries.

INFLUENCERS

  • Human population growth

  • Increasing consumption

  • Reduced resource efficiency

BIODIVERSITY LOSS: Reduction in the number of genes, individual organisms, species, and ecosystems in a given area.

Ɛhia
4
DOK 2
HS-LS2-1
Ɛhia
4
DOK 2
HS-LS2-7
Ɛhia
2
DOK 1
HS-LS2-7
Ɛhia
4
DOK 2
HS-LS2-3
Ɛhia
4
DOK 2
HS-LS2-7
Ɛhia
6
DOK 3
HS-LS2-7

Habitat fragmentation is one of the leading causes of biodiversity loss worldwide. As human development expands, forests, grasslands, and migration routes become divided by roads, housing, and agricultural fields. Many large mammals - such as elk, deer, wolves, bears, mountain lions, and even smaller species like bobcats - depend on the ability to move across large areas for food, breeding, and seasonal migration. When habitats are fragmented, animals face greater risks of vehicle collisions, reduced access to resources, and genetic isolation.

To address these challenges, many regions have implemented wildlife corridors, which are engineered structures that help animals safely cross human-made barriers. Two of the most effective designs are wildlife overpasses (vegetated bridges across highways) and underpasses (tunnels or culverts that allow animals to pass beneath roads). When combined with directional fencing that funnels animals toward these crossings, these structures significantly reduce mortality and increase habitat connectivity.

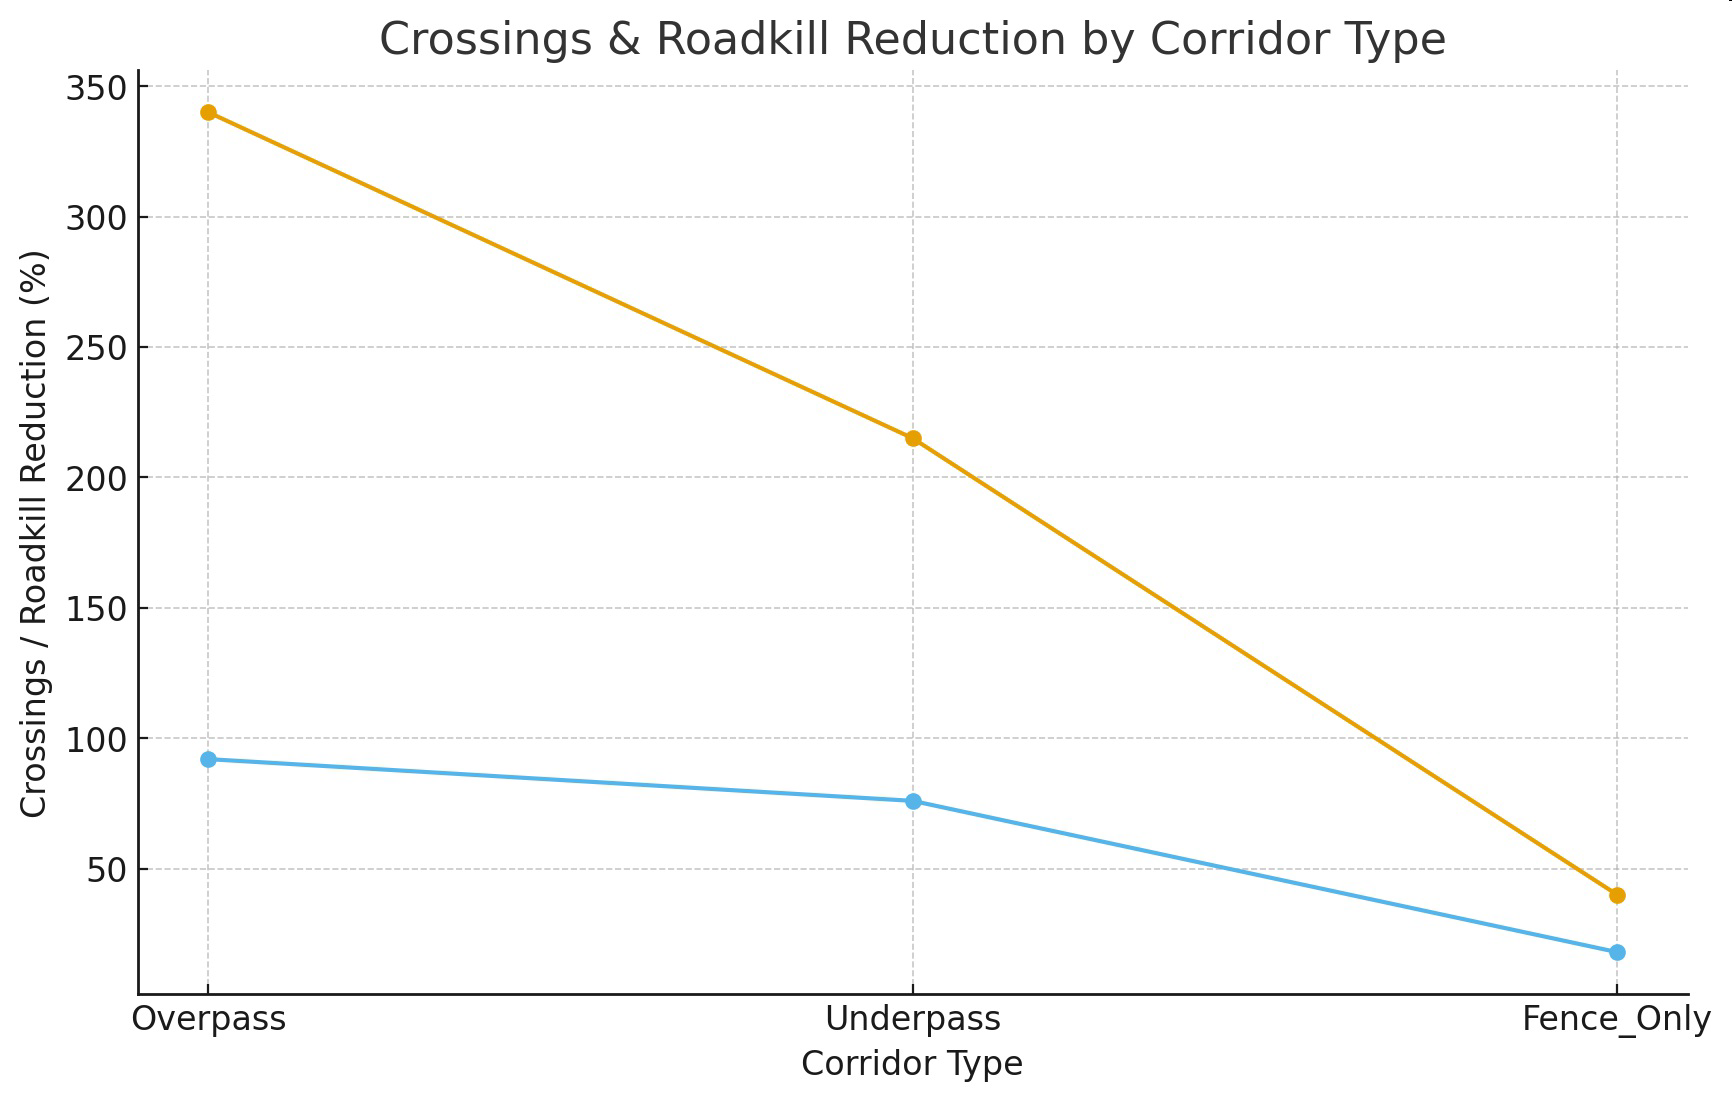
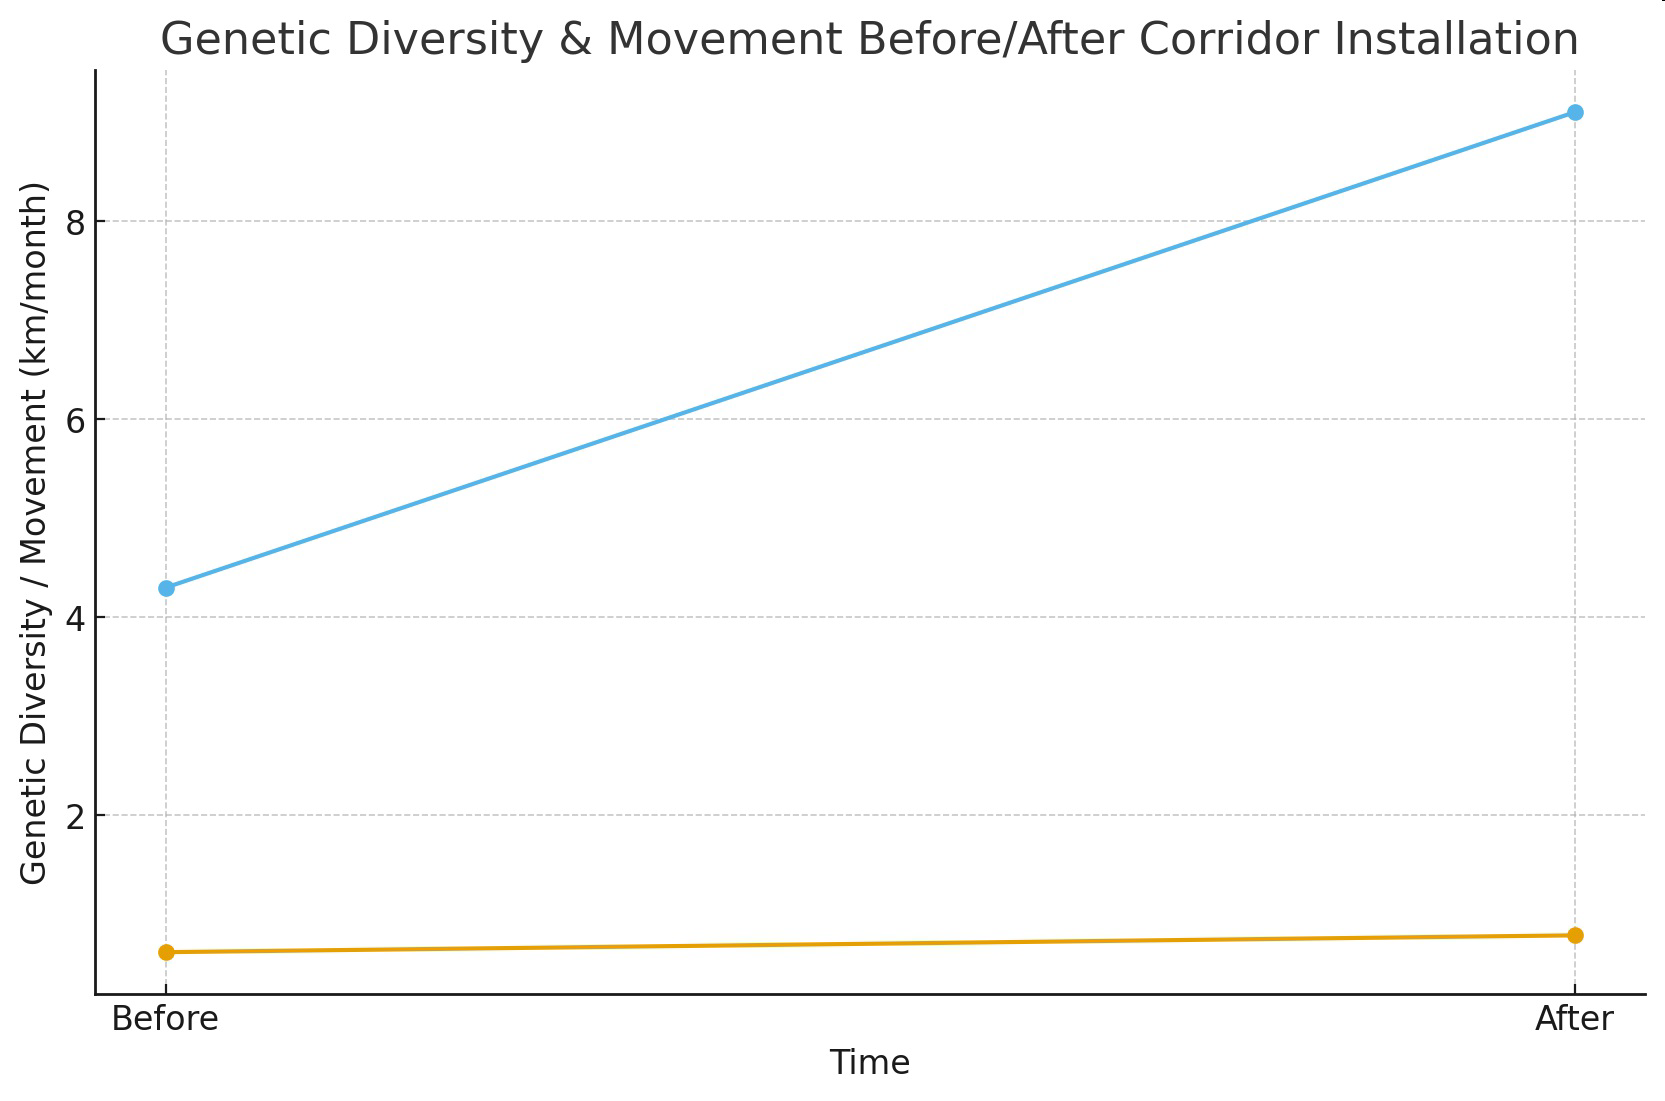
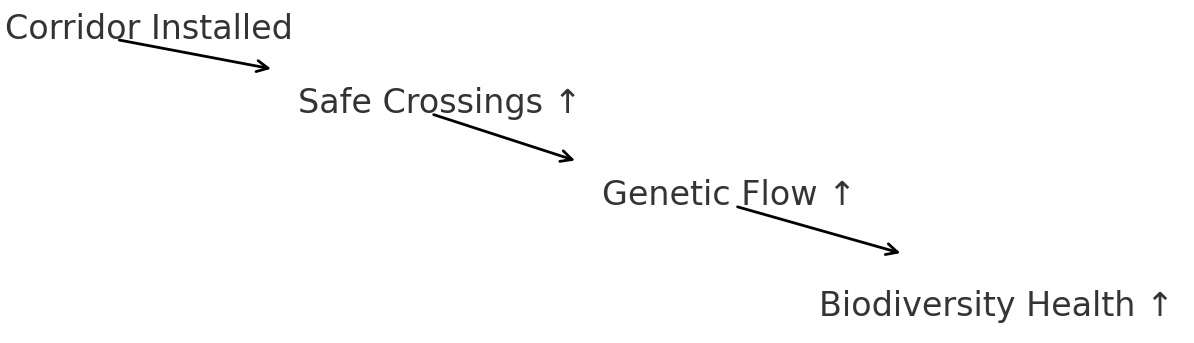
Long-term ecological monitoring shows that wildlife corridors dramatically improve conservation outcomes. Motion-activated cameras and sensor tracking reveal that many large mammals regularly use these crossings. Mathematical data consistently show two major benefits: reduced roadkill and increased genetic flow. For example, before corridors were constructed, populations separated by highways often showed low genetic diversity due to limited movement. After corridors were installed, genetic diversity increased, demonstrating renewed mixing between groups.

Road ecology scientists evaluate corridor effectiveness using metrics such as crossing frequency, mortality reduction percentage, genetic diversity indices, and changes in population movement patterns. Overpasses tend to be used by a wider variety of species, while underpasses are often preferred by predators or nocturnal animals. Fence-only systems reduce roadkill somewhat but do not improve habitat connectivity.

Designing and refining wildlife corridors requires understanding animal behavior, habitat needs, landscape structure, and engineering constraints. Placement, width, vegetation type, fencing design, and structural noise levels all influence success. Students can analyze data from different corridor types and evaluate which design features most effectively reduce human impacts on wildlife.

Table 1.

Corridor Type

Crossings per Month

Roadkill Reduction %

Overpass

340

92

Underpass

215

76

Fence_Only

40

18

Graph of Information - Figure 1.

Diagram 2.
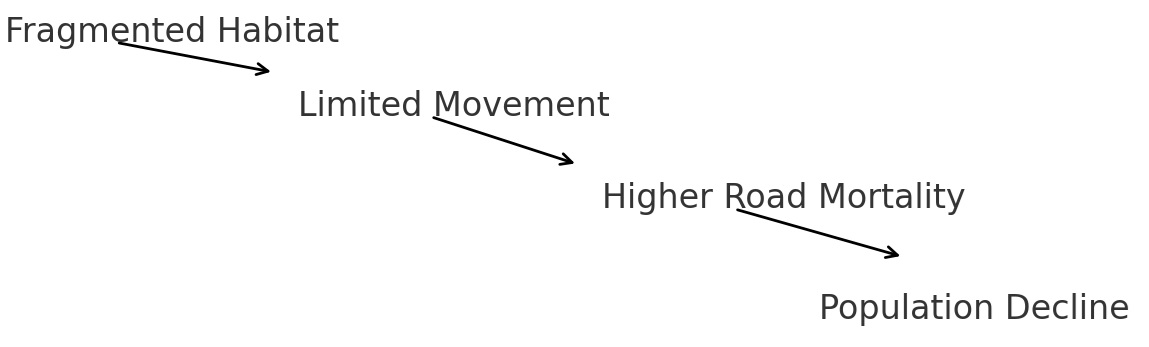
Table 2.

Time

Genetic Diversity Index

Avg Movement km/Month

Before

0.62

4.3

After

0.79

9.1

Graph of Information - Figure 2.

Diagram 3.
Asemmisa {{asɛmmisaAhyɛnsode}}
1.

Using the reading and Diagram 1, explain how habitat fragmentation acts as a limiting factor that reduces population carrying capacity for large mammals.

Asemmisa {{asɛmmisaAhyɛnsode}}
2.

According to Table 1, which corridor type has the highest number of crossings per month?

Asemmisa {{asɛmmisaAhyɛnsode}}
3.

Using Table 1 and Figure 1, describe the mathematical relationship between corridor type and roadkill reduction percentage.

Asemmisa {{asɛmmisaAhyɛnsode}}
4.

Based on Table 2, which measure shows the largest increase after corridor installation?

Asemmisa {{asɛmmisaAhyɛnsode}}
5.

Using Table 2 and Figure 2, describe how genetic diversity and average monthly movement changed before and after corridor installation. Identify one mathematical pattern.

Asemmisa {{asɛmmisaAhyɛnsode}}
6.

Evaluate the claim that wildlife corridors reduce human impacts on large-mammal ecosystems by improving movement, survival, and genetic flow.

Claim:

Evidence:

Reasoning: