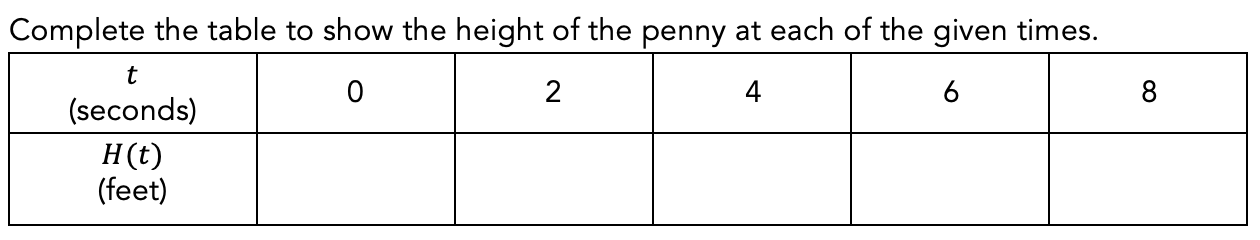
A penny is dropped from the top of the Empire State Building, from a height of 1,250 feet. The height of the penny, in feet,
A penny is dropped from the top of the Empire State Building, from a height of 1,250 feet. The height of the penny, in feet,
Find the exact time
Find the average rate of change in the penny’s height during the total length of its drop.
Determine how many feet the penny fell during each two second interval.
What do you notice?
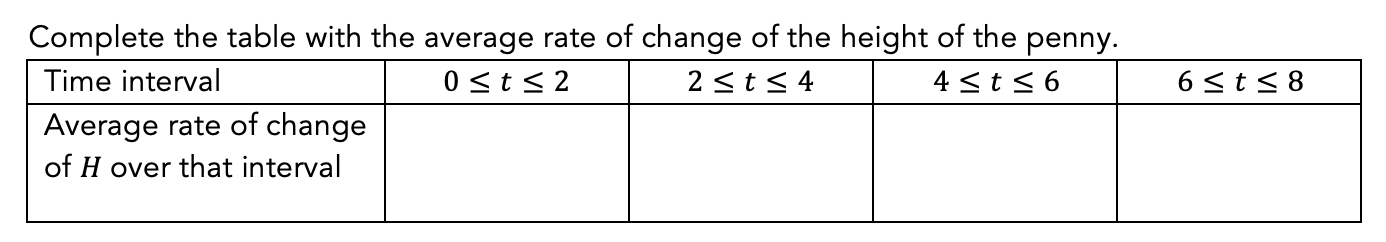
Is the penny speeding up, slowing down, or falling at a constant speed? How do you know?
Graph
Is the graph of
Here's the chart from earlier.
What do you notice about the rate of change of these average rate of changes?
How do those differences compare to the linear function from earlier?
What does that tell us about this function?
Match the function name to the table of values.
| Draggable item | arrow_right_alt | Corresponding Item |
|---|---|---|
Quadratic | arrow_right_alt | |
Exponential | arrow_right_alt | |
Linear | arrow_right_alt | |
Cubic | arrow_right_alt |
When are finding differences useful? How do we need to be careful?
What can concavity tell us about our average rate of change?


