1
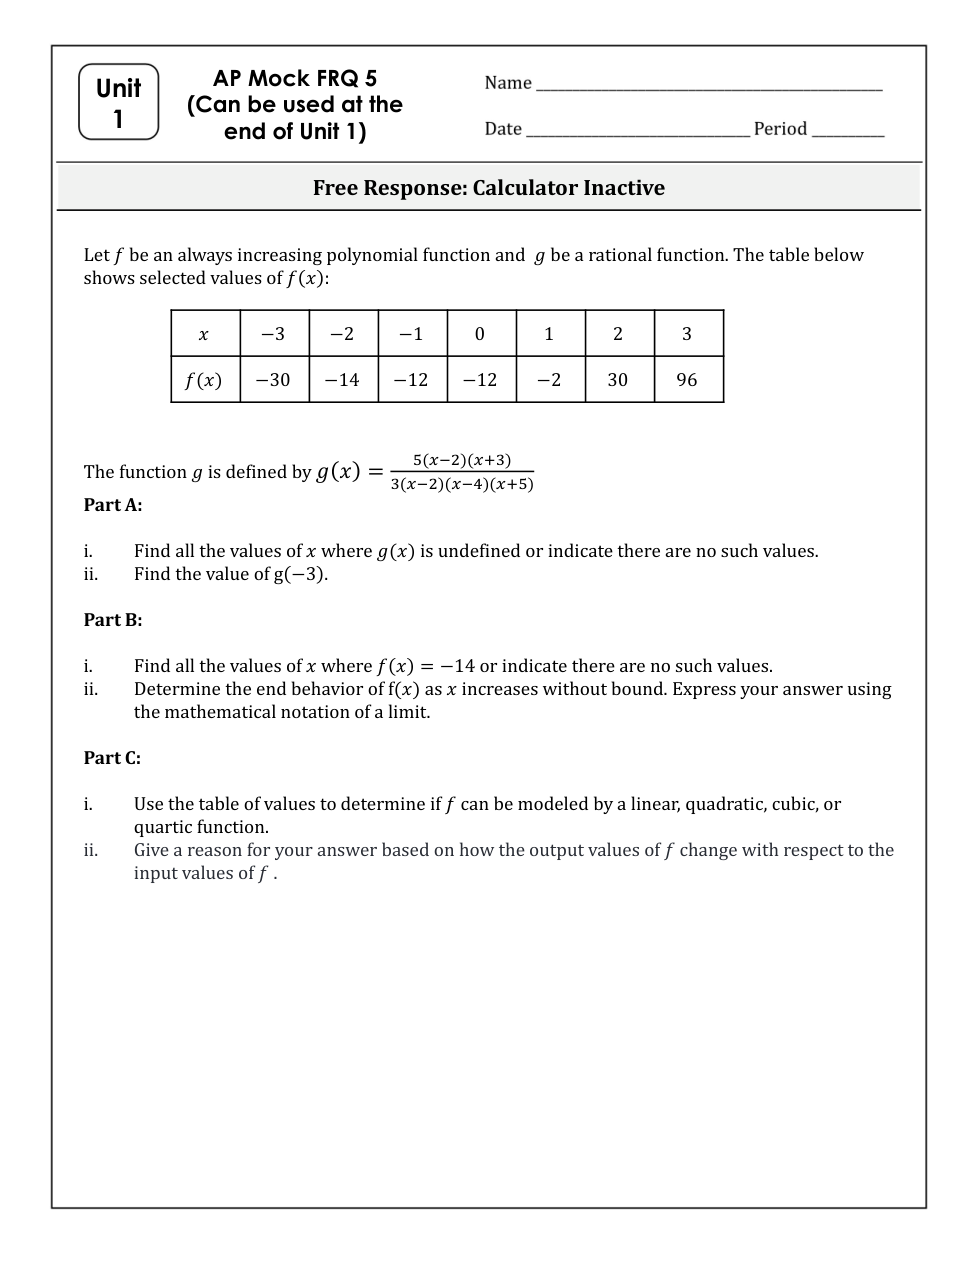
The figure shows a graph of the polynomial function $f$ in the $xy$ -plane. Which of the following could be an expression for $f(x)$ ?
The figure shows a graph of the polynomial function
The figure shows a graph of the polynomial function
For
The location of a point in the plane is given by polar coordinates
0 | 4 |
1 | 5 |
2 | 4 |
3 | 1 |
4 | −4 |
The table shows values for a function
Let

The figure shows a circle centered at the origin with an angle of measure
In the
The table below gives selected values for the function
1 | 2 | 3 | 4 | 5 | |
824 | 330 | 132 | 53 | 21 |
Which of the following graphs could represent these data in a semi-log plot, where the vertical axis is logarithmically scaled?
(A)

(B)

(C)

(D)

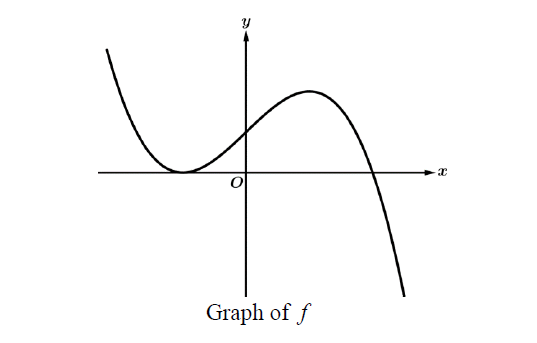
Where both expressions are defined, which of the following is equivalent to
A polynomial function

A group of students wanted to see if there is a relationship between the number of students absent on a given day and the time of year. The students estimated the number of students that were absent over a period of time. Then, the students developed a linear regression model for the number of absences over time. The figure shows a graph of the residuals of the linear regression. Which of the following statements about the linear regression is true?

The figure shows the graph of the sinusoidal function
LEAVE ANSWERS IN EXACT FORM