Lake Eutrophication and Shift to Algae-Dominated State
Many freshwater lakes naturally maintain clear water, high dissolved oxygen, and diverse plant and animal communities. These stable ecosystems depend on balanced nutrient cycles, healthy populations of submerged plants, and strong interactions among algae, grazers, fish, and decomposers. However, human activities have dramatically altered nutrient inputs into lakes through fertilizer runoff, wastewater discharge, and stormwater contamination. When nutrient levels rise, the ecosystem can shift away from a stable clear-water state into a new, persistent state dominated by algae.
In a clear-water lake, nutrients like nitrogen and phosphorus are kept at low levels, supporting modest algal populations. Submerged aquatic plants grow on the lake bottom and provide habitat for fish and invertebrates. Zooplankton grazing further limits algae, helping maintain water clarity. Under these conditions, oxygen levels remain high, supporting a rich community of fish and other aerobic organisms.
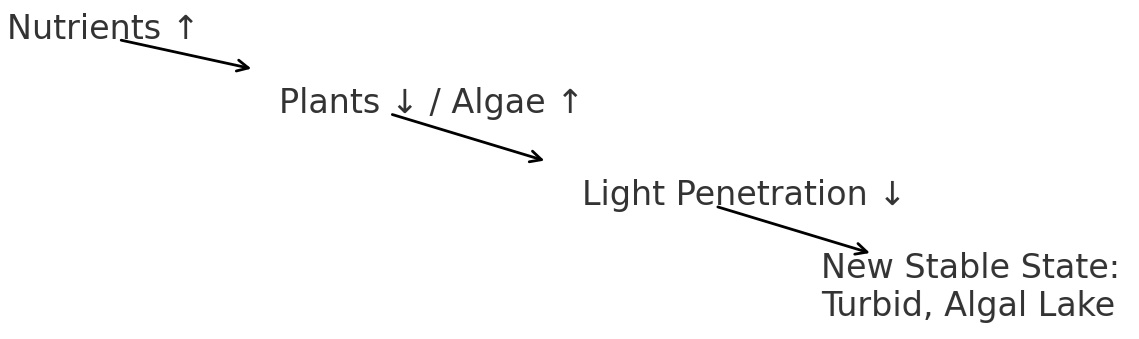
When nutrient loading increases - even slightly - algae grow rapidly. Algal blooms reduce light penetration, causing submerged plants to die. As plants decompose, microorganisms consume oxygen, lowering dissolved oxygen levels in the lake. Low oxygen stresses or kills fish, further disrupting predator–prey interactions. Mathematical data often show parallel declines in oxygen and fish abundance as bloom severity increases.
As the lake becomes more turbid, a powerful feedback loop begins. With fewer plants, nutrients remain available for algae rather than being stored in plant tissues. Zooplankton grazing pressure may decrease if small fish increase in abundance due to altered habitat or changing food availability. Algal blooms intensify, leading to even greater declines in water clarity and oxygen.
Eventually, the lake can settle into a new stable state: a turbid, algae-dominated ecosystem. This condition is difficult to reverse because the original stabilizing interactions - plant growth, nutrient recycling, and strong grazing pressure - have been disrupted. Even reducing nutrient inputs may not fully restore the clear-water state without active intervention, such as aeration, biomanipulation, or plant restoration.
Table 1.
Nutrient Load mg/L | Algal Biomass µg/L | Water Clarity m |
|---|
0.02 | 8 | 5.2 |
0.05 | 15 | 4.4 |
0.1 | 32 | 3.1 |
0.2 | 68 | 1.9 |
0.35 | 120 | 0.8 |
Graph of Information - Figure 1.
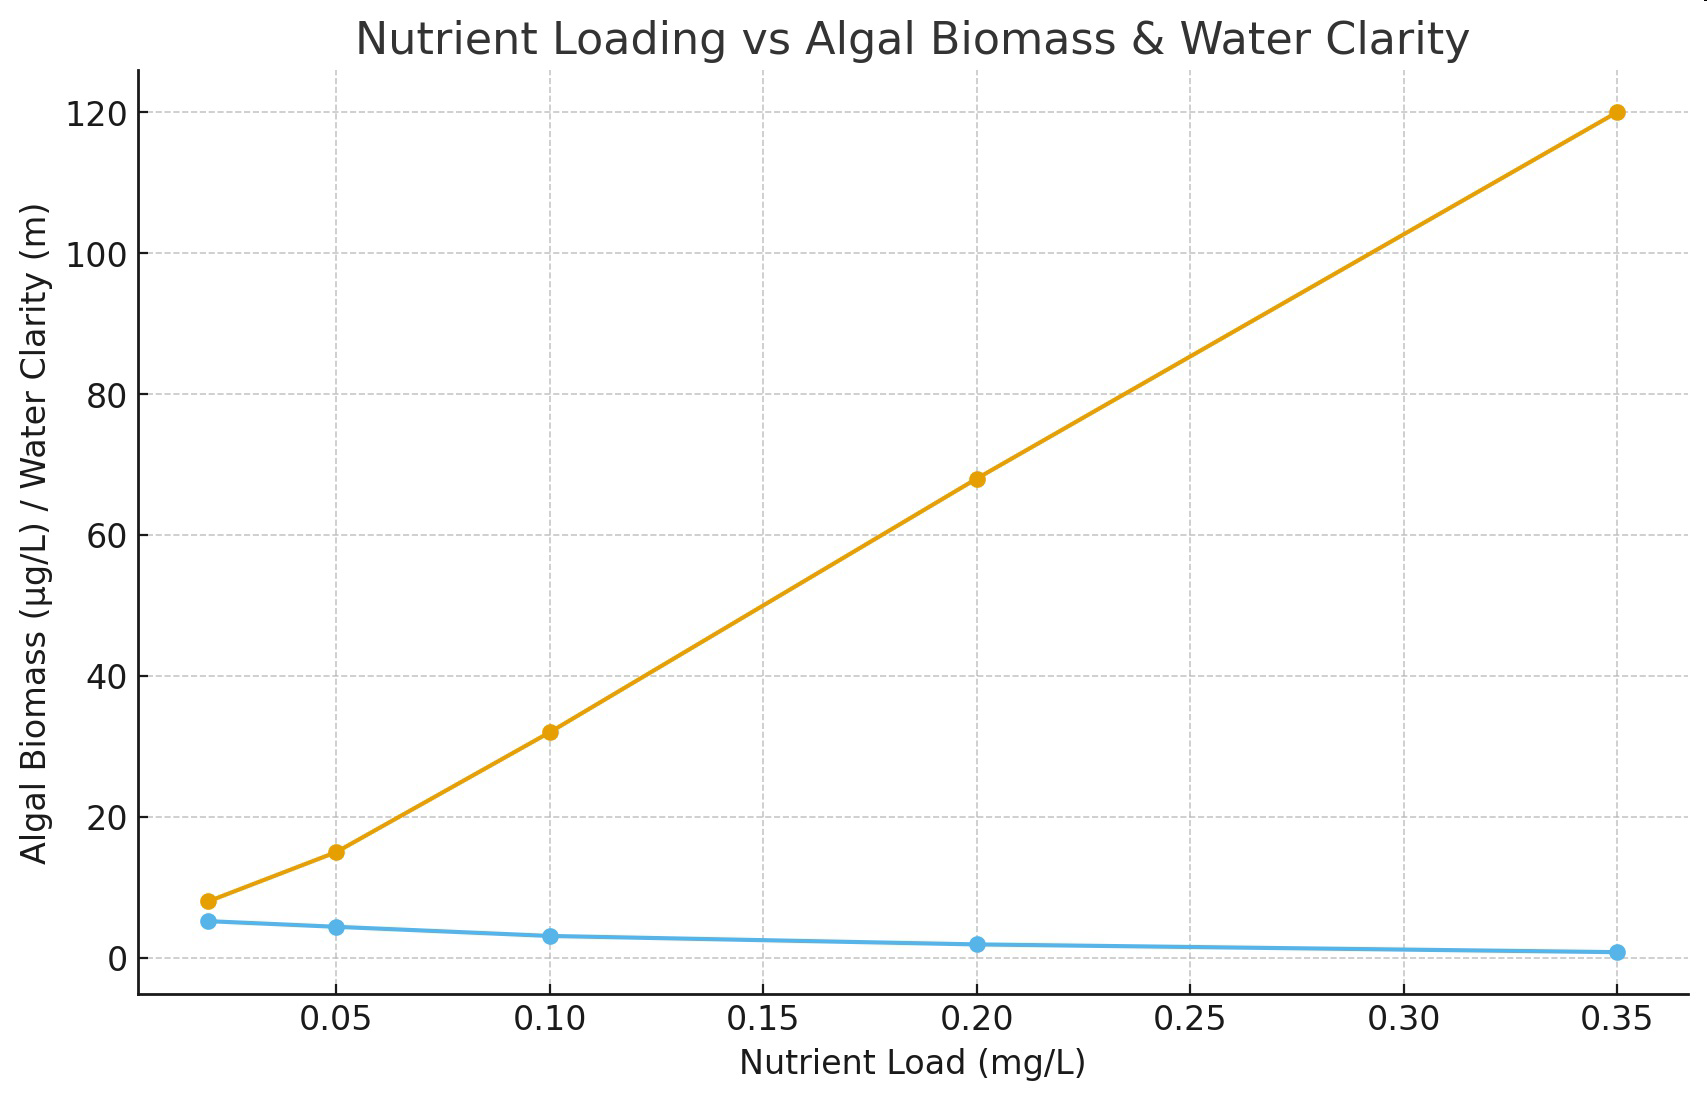
Diagram 1.
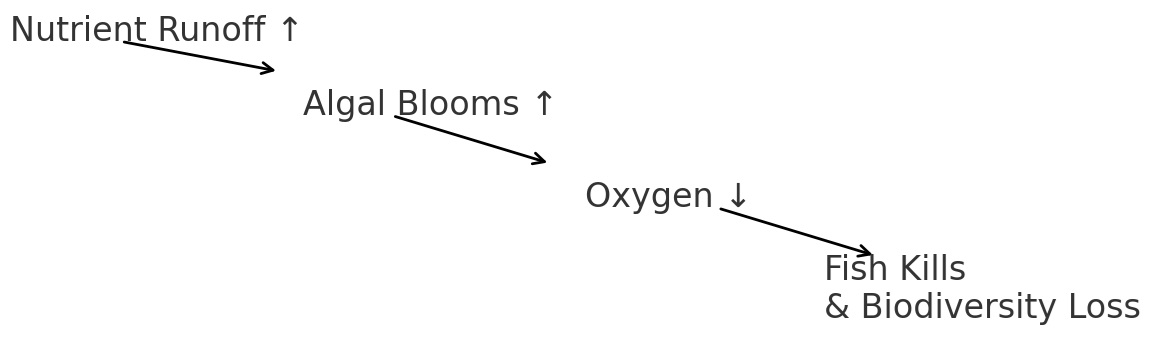
Table 2.
Year | Dissolved Oxygen mg/L | Fish Abundance Index | Bloom Severity Index |
|---|
2000 | 8.5 | 620 | 1.1 |
2005 | 7.9 | 540 | 1.8 |
2010 | 6.8 | 410 | 3 |
2015 | 4.9 | 260 | 4.2 |
2020 | 3.2 | 130 | 5.1 |
Graph of Information - Figure 2.
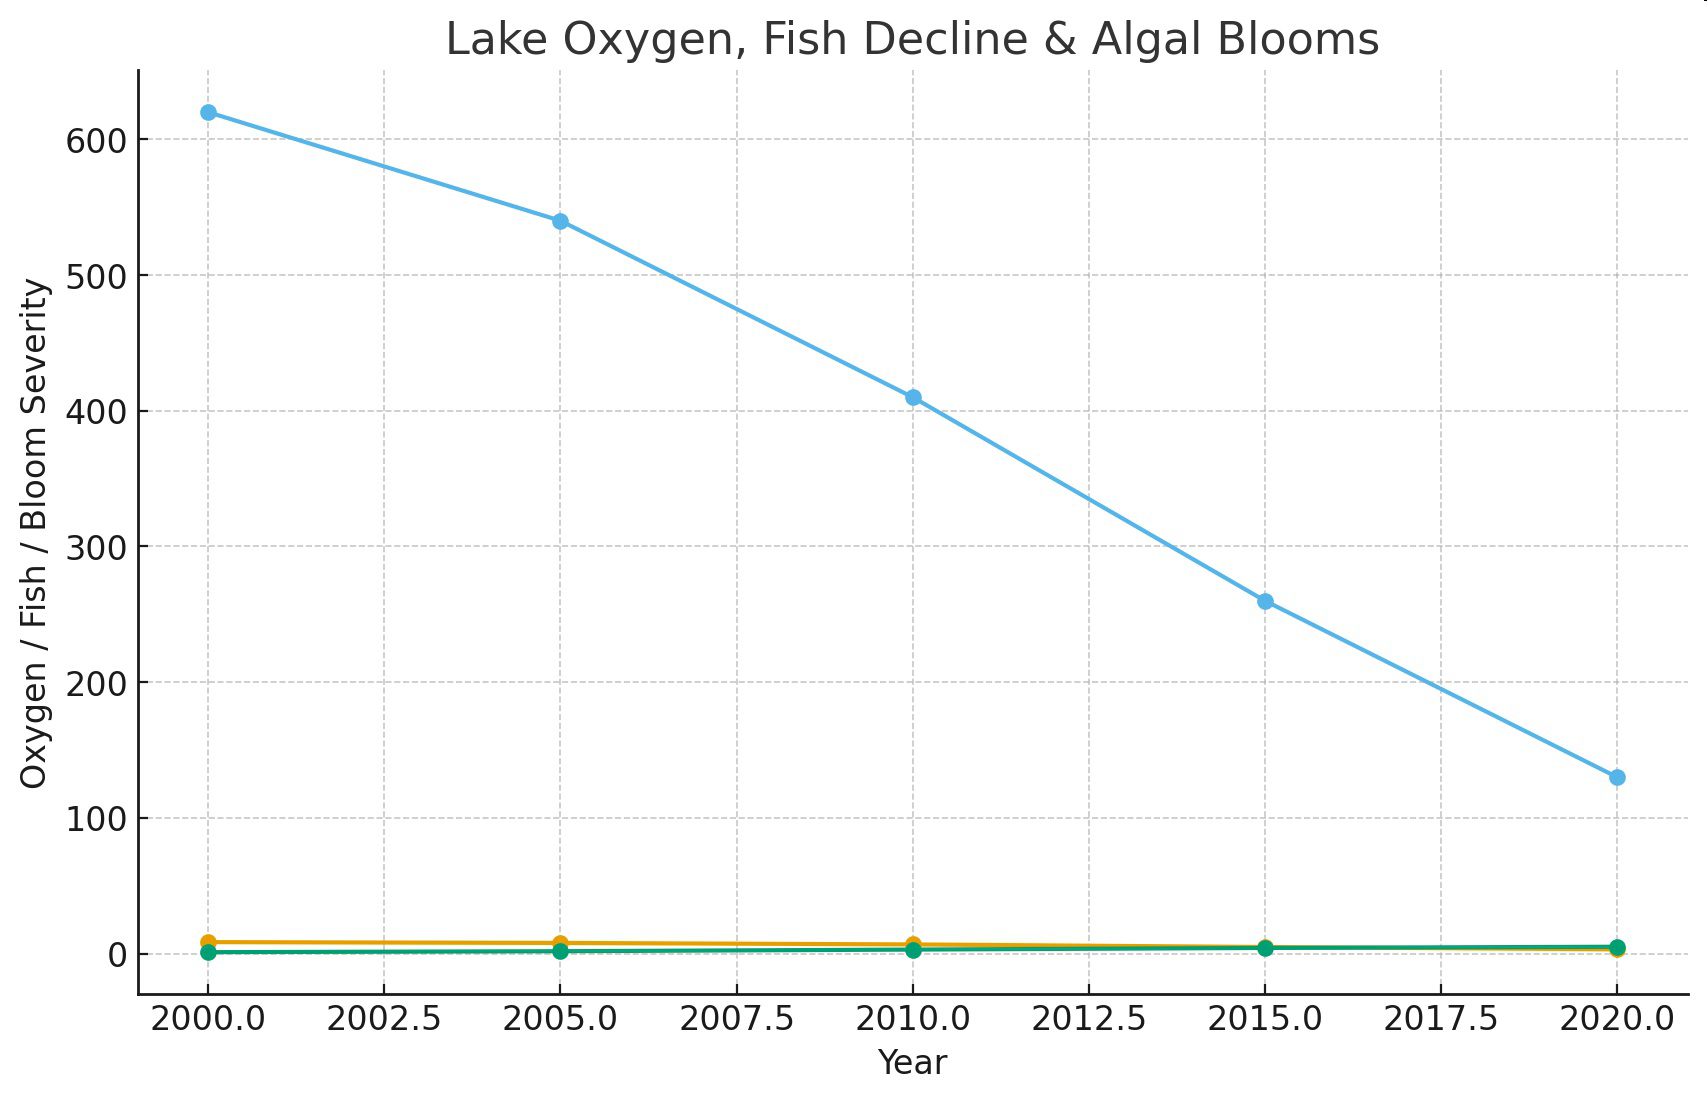
Diagram 2.