Length of Growing Season
Key Points
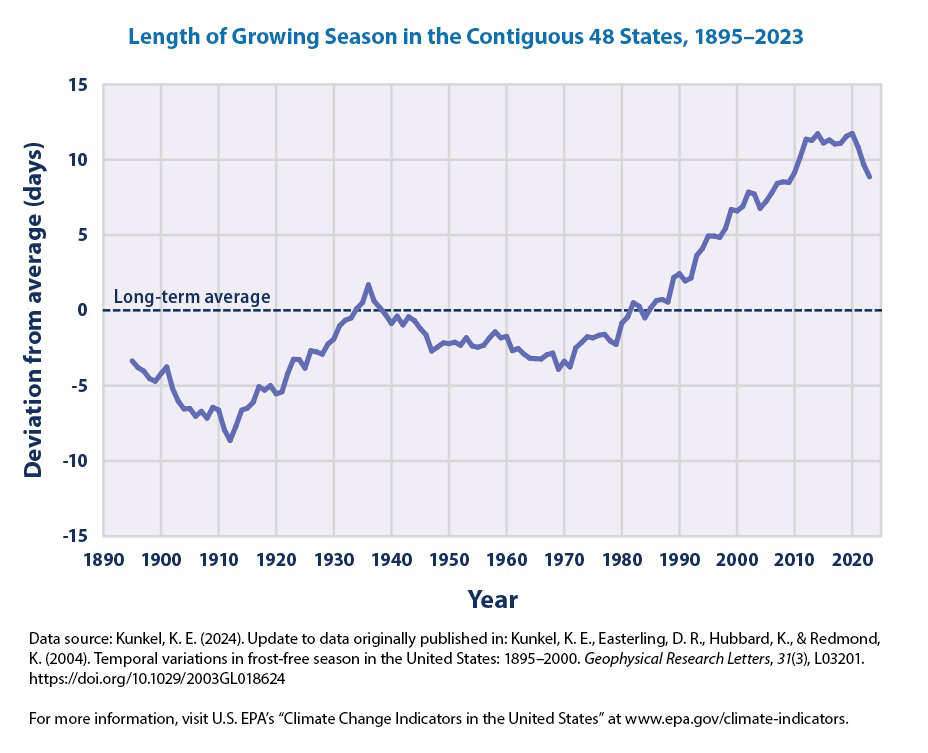
The average length of the growing season in the contiguous 48 states has increased by more than two weeks since the beginning of the 20th century. A particularly large and steady increase has occurred since the 1970s (Figure 1).
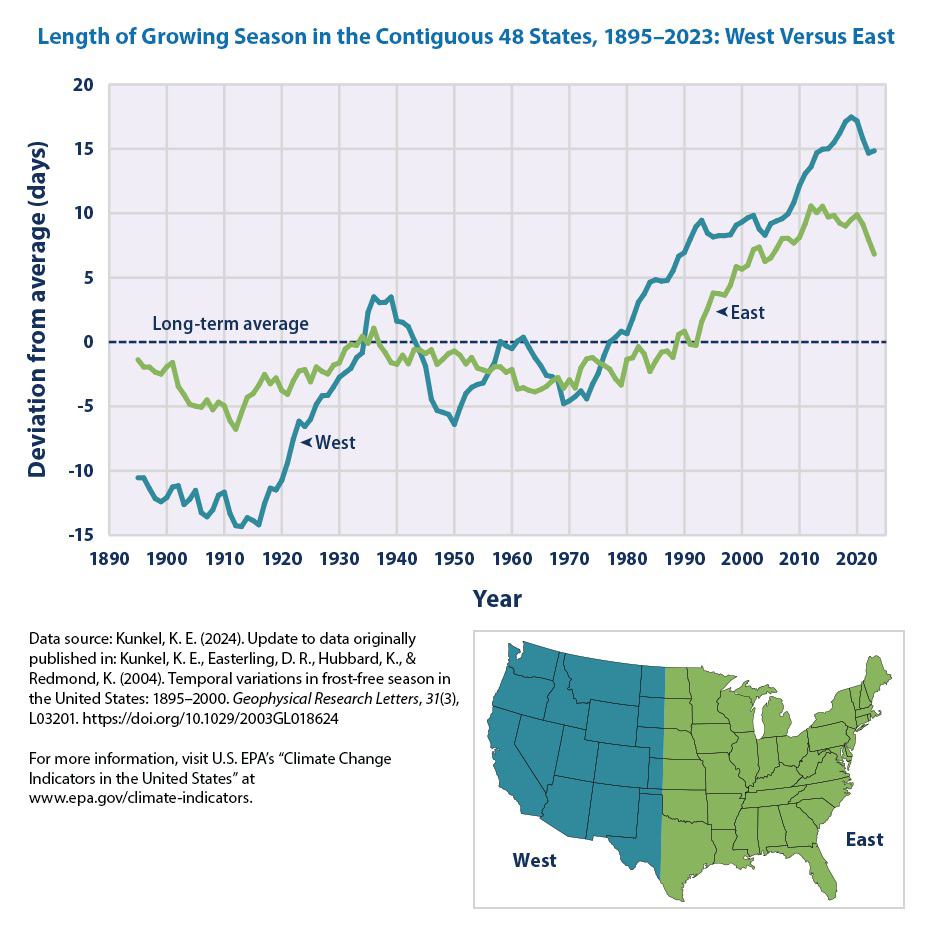
The length of the growing season has increased more rapidly in the West than in the East. In the West, the length of the growing season has increased at an average rate of about 2.2 days per decade since 1895, compared with a rate of nearly one day per decade in the East (Figure 2).
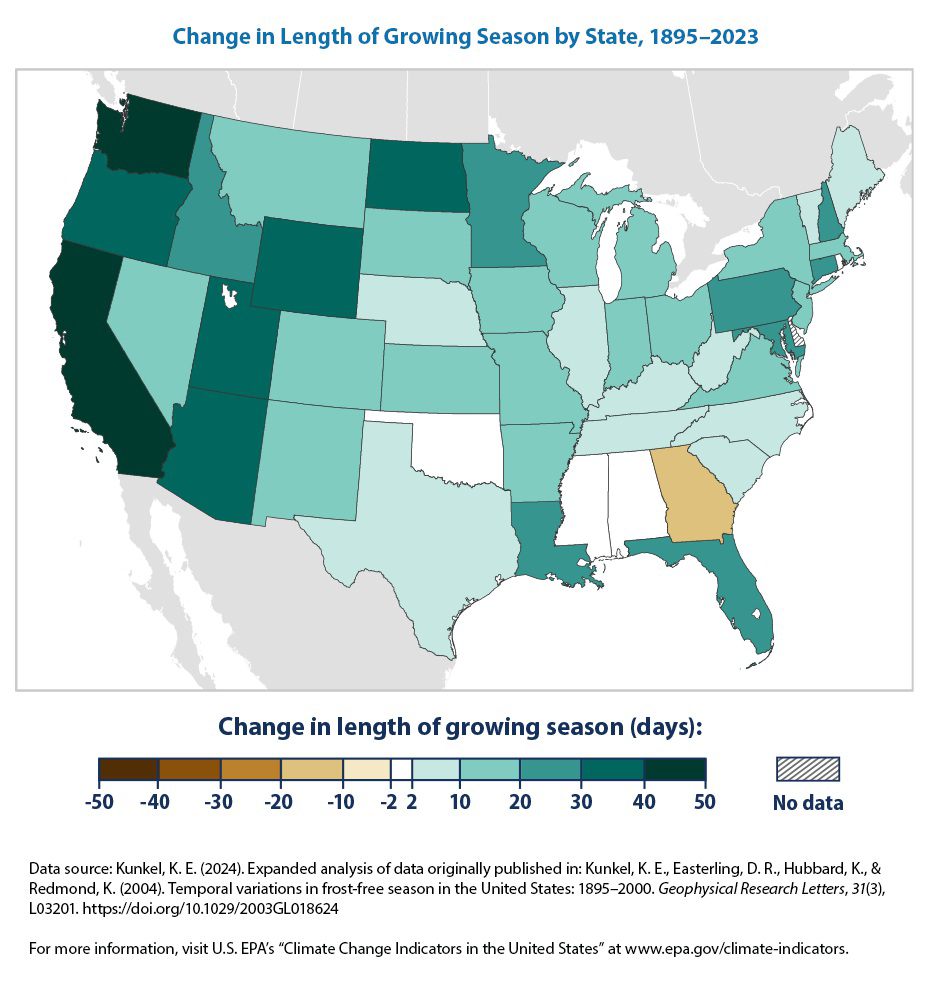
The length of the growing season has increased in almost every state. States in the West (e.g., California and Washington) have seen the most dramatic increase. In contrast, the growing season has become slightly shorter in Georgia (Figure 3).
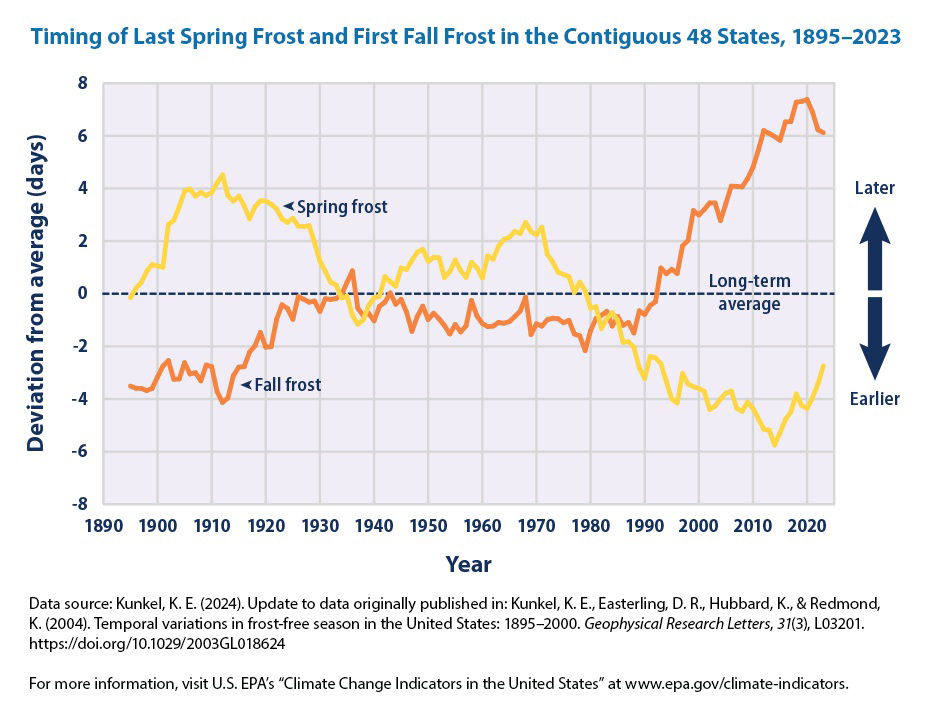
In recent years, the final spring frost has been occurring earlier than at any point since 1895, and the first fall frost has been arriving later. Since 1980, the last spring frost has occurred an average of more than three days earlier than the long-term average, and the first fall frost has occurred about three days later (Figure 4).
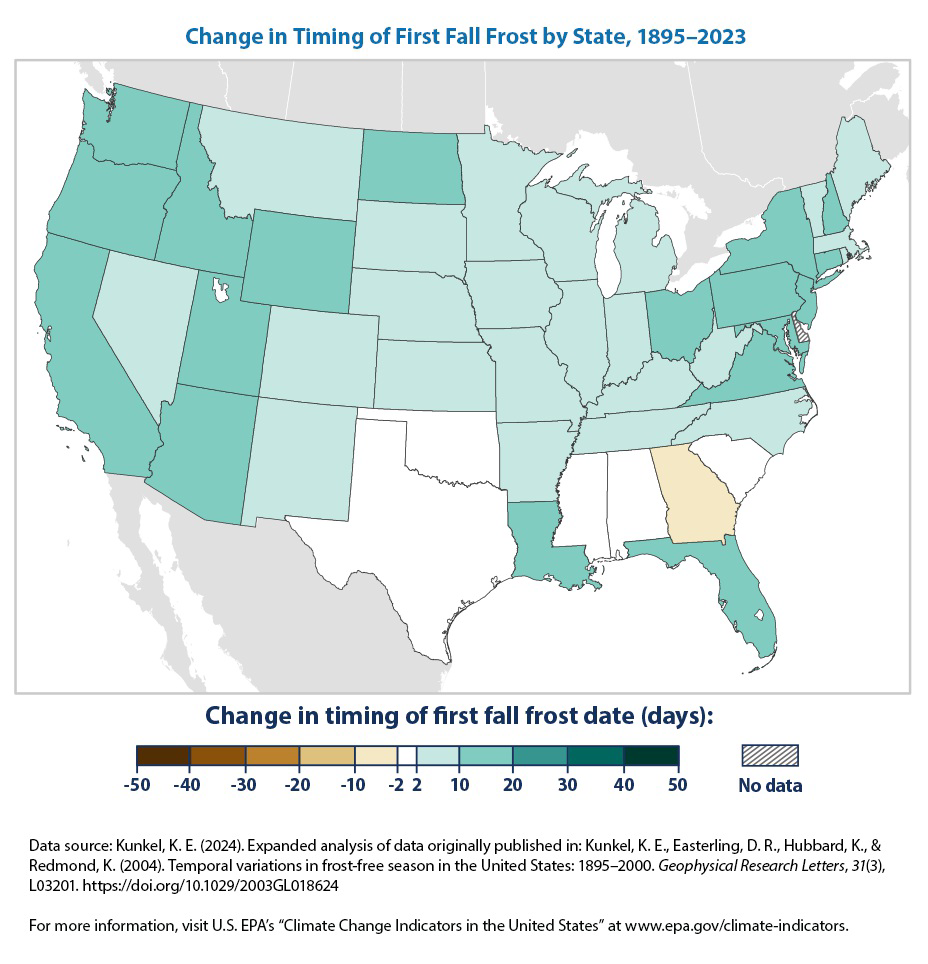
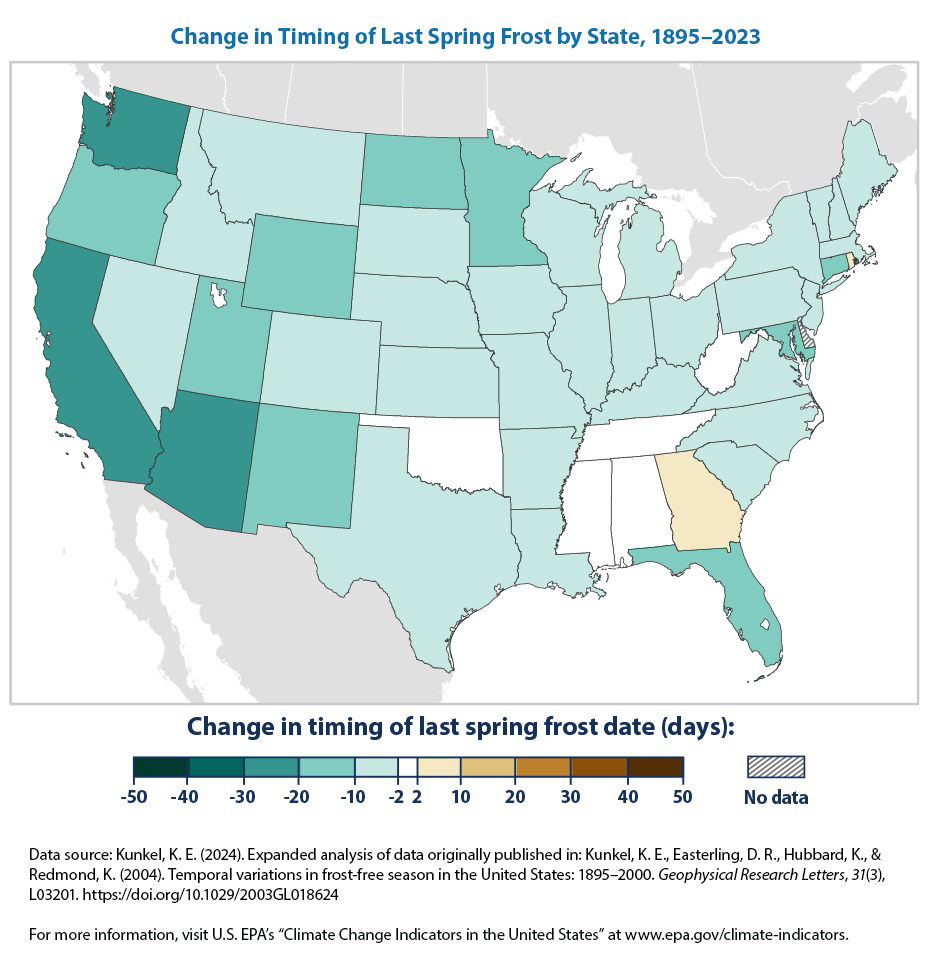
Patterns in the timing of spring and fall frost (Figures 5 and 6) largely mirror the overall patterns in the length of growing season (Figure 3). States that saw an increased length of growing season had comparable changes in frost-free days for both the spring and fall.
Background
The length of the growing season in any given region refers to the number of days when plant growth takes place. The growing season often determines which crops can be grown in an area, as some crops require long growing seasons, while others mature rapidly. Growing season length is limited by many different factors. Depending on the region and the climate, the growing season is influenced by air temperatures, frost days, rainfall, or daylight hours.
Changes in the length of the growing season can have both positive and negative effects on the yield and prices of particular crops. Overall, warming is expected to have negative effects on yields of major crops, but crops in some individual locations may benefit. A longer growing season could allow farmers to diversify crops or have multiple harvests from the same plot. However, it could also limit the types of crops grown, encourage invasive species or weed growth, or increase demand for irrigation. A longer growing season could also disrupt the function and structure of a region’s ecosystems and could, for example, alter the range and types of animal species in the area.
Graph of Information - Figure 1.
This figure shows the length of the growing season in the contiguous 48 states compared with a long-term average. For each year, the line represents the number of days shorter or longer than average. The line was smoothed using an 11-year moving average. Choosing a different long-term average for comparison would not change the shape of the data over time.
Graph of Information - Figure 2.
This figure shows the length of the growing season in the western and eastern United States compared with a long-term average. For each year, the line represents the number of days shorter or longer than average. The lines were smoothed using an 11-year moving average. Choosing a different long-term average for comparison would not change the shape of the data over time.
Graph of Information - Figure 3.
This map shows the total change in length of the growing season from 1895 to 2023 for each of the contiguous 48 states.
Graph of Information - Figure 4.
This figure shows the timing of the last spring frost and the first fall frost in the contiguous 48 states compared with a long-term average. Positive values indicate that the frost occurred later in the year, and negative values indicate that the frost occurred earlier in the year. The lines were smoothed using an 11-year moving average. Choosing a different long-term average for comparison would not change the shape of the data over time.
Graph of Information - Figure 5.
This map shows the total change in last spring frost date from 1895 to 2023 for each of the contiguous 48 states.
Graph of Information - Figure 6.
This map shows the total change in first fall frost date from 1895 to 2023 for each of the contiguous 48 states.