An exponential function is graphed on the grid.
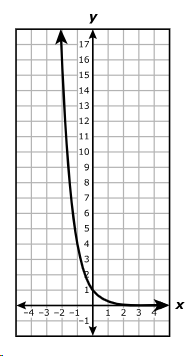
Which function is best represented by the graph?
An exponential function is graphed on the grid.
Which function is best represented by the graph?
What is the equation of the asymptote of the graph of the function
Move the correct answer to each box. Not all answers will be used.
=
x
0
16
0.75
12
y
Researchers studied the population of a town over time and modeled the data using an exponential function.
-The initial estimated population was 48,000
-After the first year, the population of the town was 50,400.
If the population of the town continues to grow at this rate each year, which function can be used to model the population x years after the researchers began their study?
Which statement about
The function
This year the number of students who participated in sports was 317. Each year the number of students who participate in sports increases by 4%.
Which function can be used to model the number of students participating in sports after x years?
A customer purchases an electronic device for $650. Each year the value of the electronic device decreases by 30%.
Which statement is true about the graph that represents the relationship between the value of the device in dollars, y, and the number of years, x, since the device was purchased?
An exponential function is graphed on the grid.
Which function is best represented by the graph?
What is the value of the y-intercept of the graph of
Record your answer below.
The initial value of a home is $200,000. The value of the home will increase at a rate of 6% each year.
Which graph best models this situation?
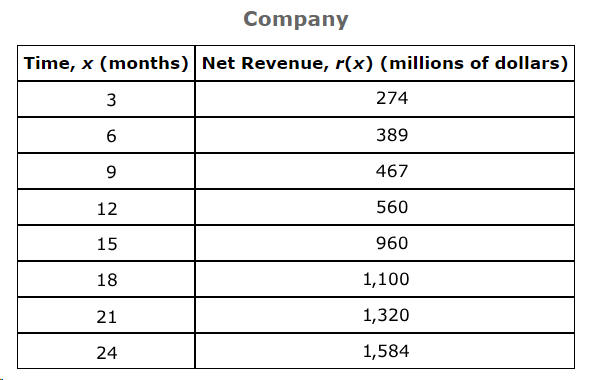
The table shows the net revenue in millions of dollars of a company every three months for two years. An exponential function can be used to model the data.
Which function best models the data?