A part of a linear function is shown on the grid.
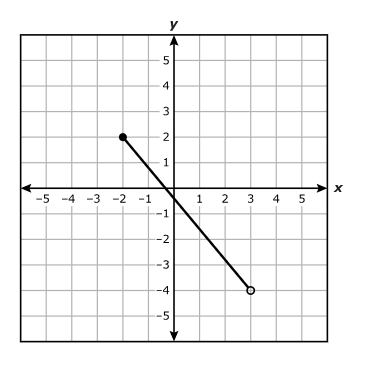
What is the range of the part of the linear function shown?
Choose the correct answer from each drop-down menu to complete the sentence.
The range is the set of all real numbers and
A part of a linear function is shown on the grid.
What is the range of the part of the linear function shown?
Choose the correct answer from each drop-down menu to complete the sentence.
The range is the set of all real numbers and
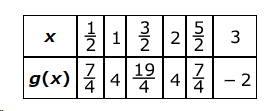
The table represents some points on the graph of quadratic function g.
What is the range of g?
The domain and range of part of a linear function r are given
x > 5
y < 2
Which graph could represent this part of linear function r?