Streamflow
Key Points
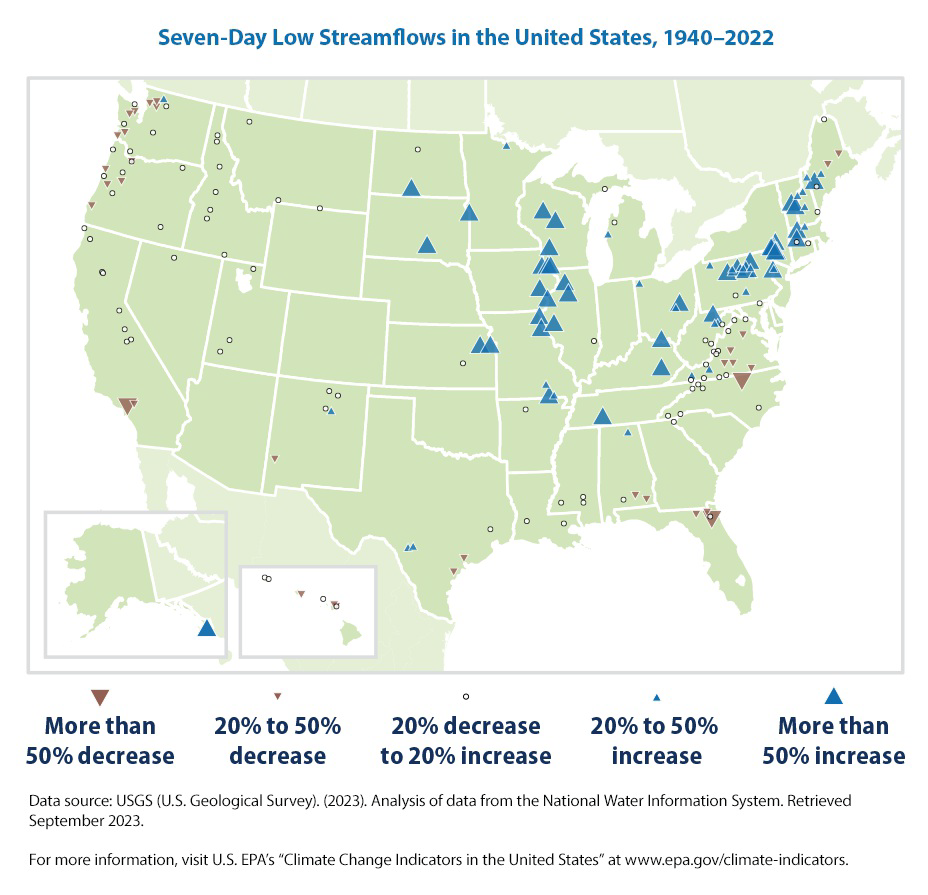
During the past 83 years, seven-day low flows have generally increased in the Northeast and Midwest (in other words, on the days of lowest flows, streams in these areas are carrying more water than before). Low flows have generally decreased in parts of the Southeast and the Pacific Northwest (that is, streams are carrying less water than before). Overall, more sites have experienced increases than decreases (see Figure 1).
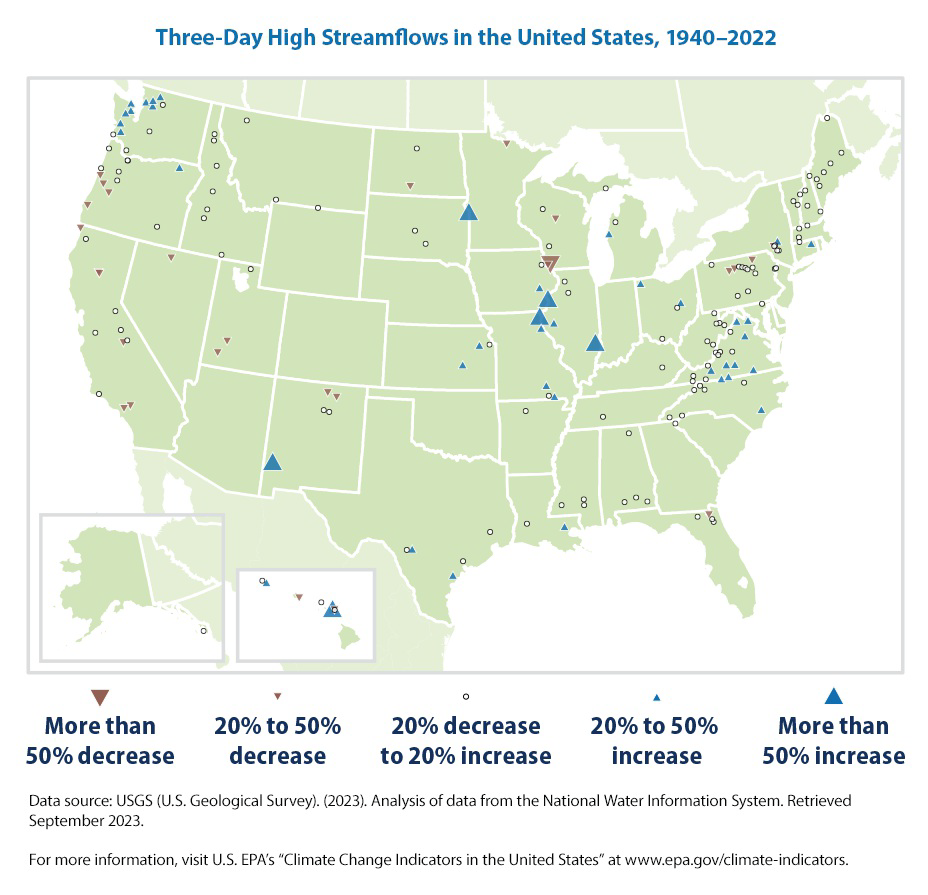
Three-day high-flow trends vary from region to region across the country. For example, high flows have generally increased or changed little in parts of the Mid-Atlantic and Midwest since 1940, whereas high flows have increased in some West Coast streams and decreased in others. Overall, more sites have experienced increases than decreases (see Figure 2).
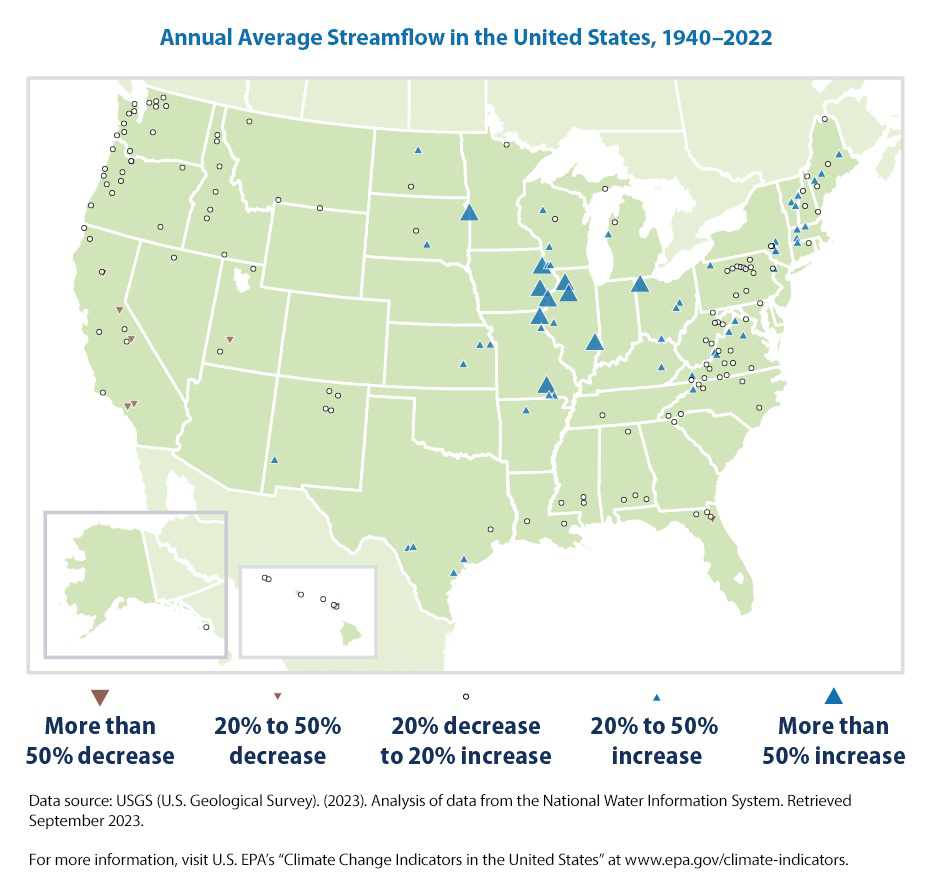
Annual average streamflow has increased at many sites in the Northeast and Midwest, while other regions have seen few substantial changes. Overall, sites show more increases than decreases (see Figure 3).
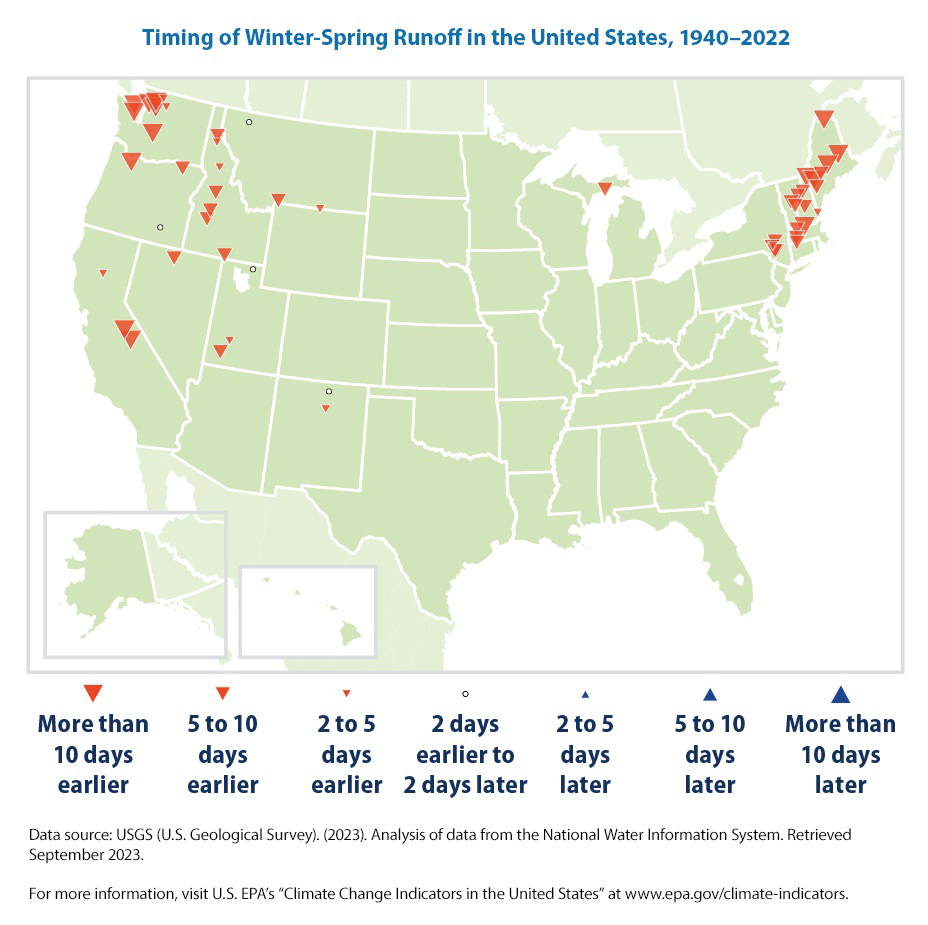
In parts of the country with substantial snowmelt, winter-spring runoff is happening at least five days earlier than in the mid-20th century at most gauges. The largest changes have occurred in the Pacific Northwest and Northeast (see Figure 4).
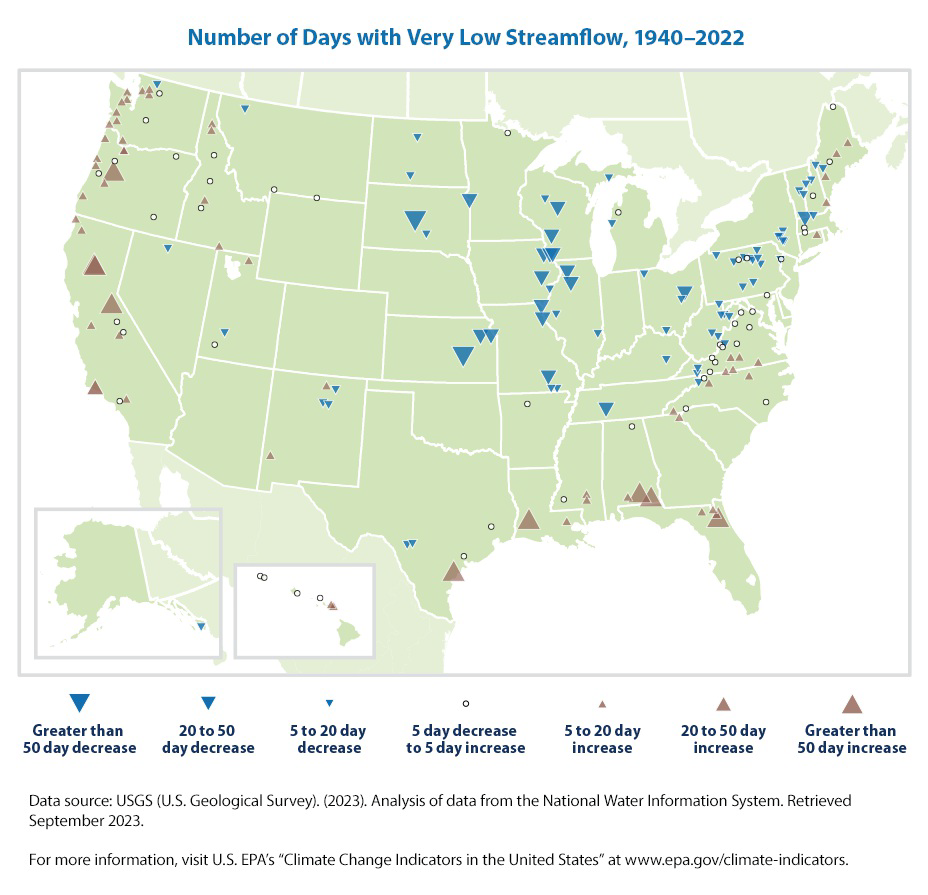
The number of days that met the Q2 threshold, a measure of dryness, decreased at many streams in the Northeast and Midwest, meaning the number of days with very low streamflow decreased through time. Dryness increased at many streams in the Southeast, the Northwest, and California (see Figure 5). These results generally align with the geographic patterns in seven-day low flows (Figure 1).
Background
Streamflow is a measure of the rate at which water is carried by rivers and streams, and it represents a critical resource for people and the environment. Changes in streamflow can directly influence the supply of drinking water and the amount of water available for irrigating crops, generating electricity, and other needs. In addition, many plants and animals depend on streamflow for habitat and survival.
Streamflow naturally varies over the course of a year. For example, rivers and streams in many parts of the country have their highest flow when snow melts in the spring and their lowest flow in late summer. The amount of streamflow is important because very high flows can cause erosion and damaging floods, while very low flows can diminish water quality, harm fish, reduce the amount of water available for people to use, and disrupt economic activities like river shipping. The timing of high flow is important because it affects the ability of reservoir managers to store water to meet needs later in the year. In addition, some plants and animals (such as fish that migrate) depend on a particular pattern of streamflow as part of their life cycles.
Climate change can affect streamflow in several ways. Changes in the amount of spring snowpack and air temperatures that influence melting can alter the size and timing of high spring streamflows. More precipitation is expected to cause higher average streamflow in some places, while heavier storms could lead to larger peak flows. More frequent or severe droughts, however, could reduce streamflow in certain areas.
Graph of Information - Figure 1.
This map shows percentage changes in the minimum annual streamflow for rivers and streams across the country, based on the long-term rate of change from 1940 to 2022. Minimum streamflow is based on the consecutive seven-day period with the lowest average flow during a given year.
Graph of Information - Figure 2.
This map shows percentage changes in the maximum annual streamflow for rivers and streams across the country, based on the long-term rate of change from 1940 to 2022. Maximum streamflow is based on the consecutive three-day period with the highest average flow during a given year.
Graph of Information - Figure 3.
This map shows percentage changes in the annual average streamflow for rivers and streams across the country, based on the long-term rate of change from 1940 to 2022. This map is based on daily streamflow measurements, averaged over the entire year.
Graph of Information - Figure 4.
This map shows changes in the timing of annual high winter-spring flow carried by rivers and streams from 1940 to 2022. This analysis focuses on parts of the country where streamflow is strongly influenced by snowmelt. Trends are based on the winter-spring center of volume, which is the date when half of the total
January 1–July 31 streamflow (in the West) or half of the total January 1–May 31 streamflow (in the East) has passed by each streamflow gauge, reflecting the timing of spring snowmelt.
Graph of Information - Figure 5.
This map shows changes in the number of days with very low streamflow for rivers and streams across the country, from 1940 to 2022. This map is based on the number of daily flow values below the 2-percentile flow (Q2) threshold. Positive trends (upward brown triangles) indicate an increase in the number of days per year at or below the Q2 threshold (drier conditions); negative trends (downward blue triangles) indicate a trend toward
fewer very low flow days (wetter conditions).