Obavezno
1
Do not use $ in your answer
Do not use $ in your answer
Obavezno
1
Obavezno
1
Do not use $ in your answer
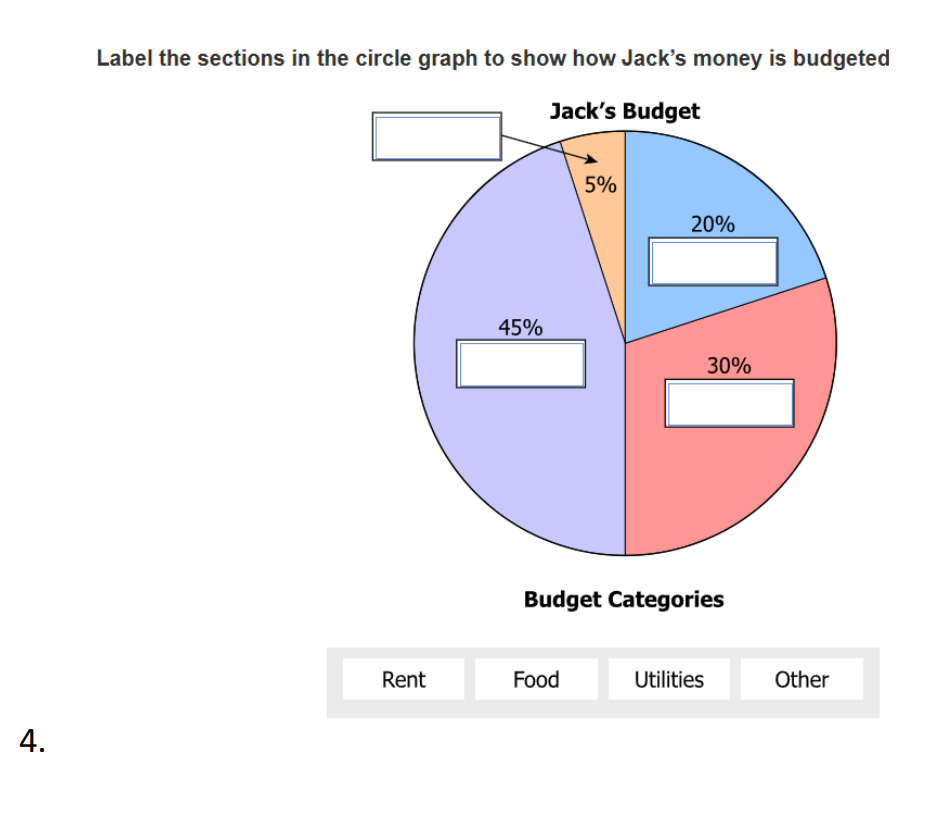
Food
Other
Rent
Utilities
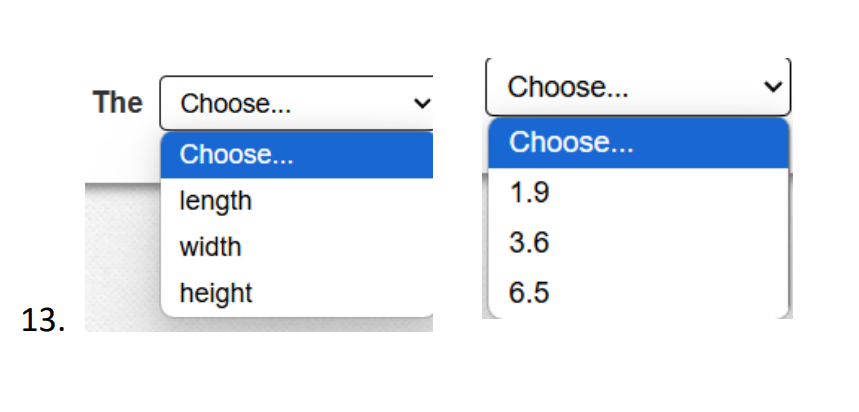
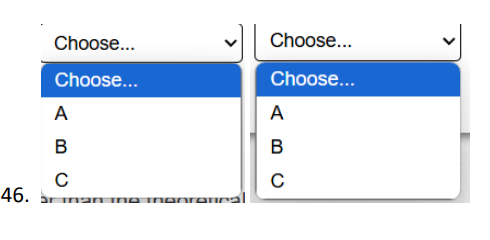
Click on the correct answers.
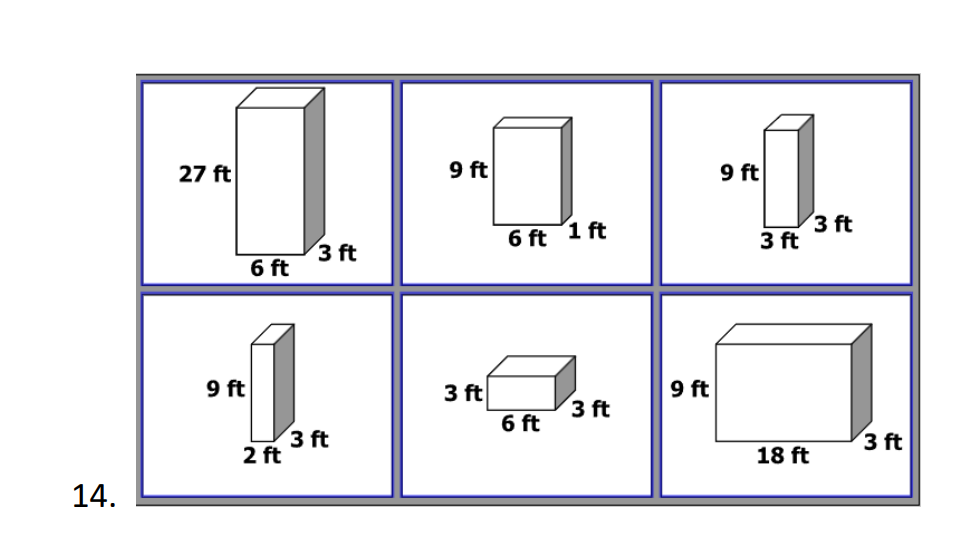
Select the correct responses.
Select the correct answers.
Select the correct answers.
Select the correct answers
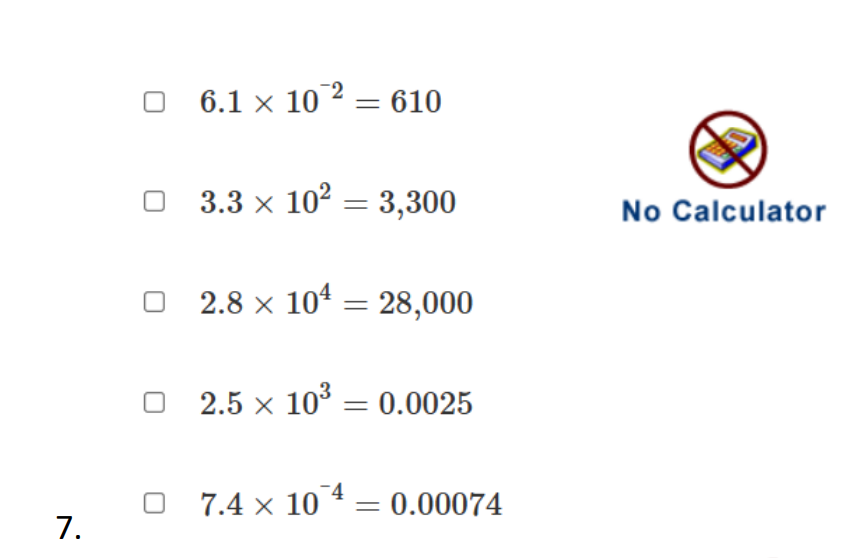
Select all correct answers.
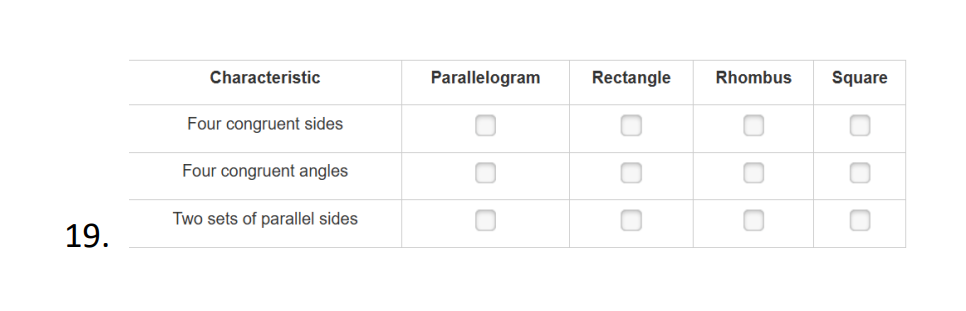
Select all correct answers.
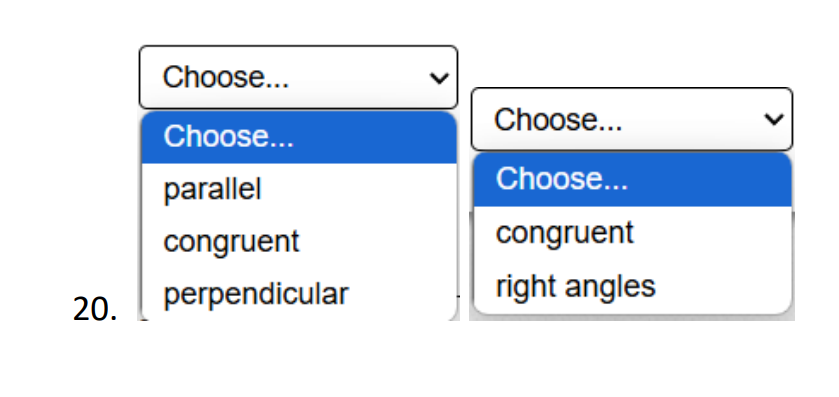
Select all correct answers.
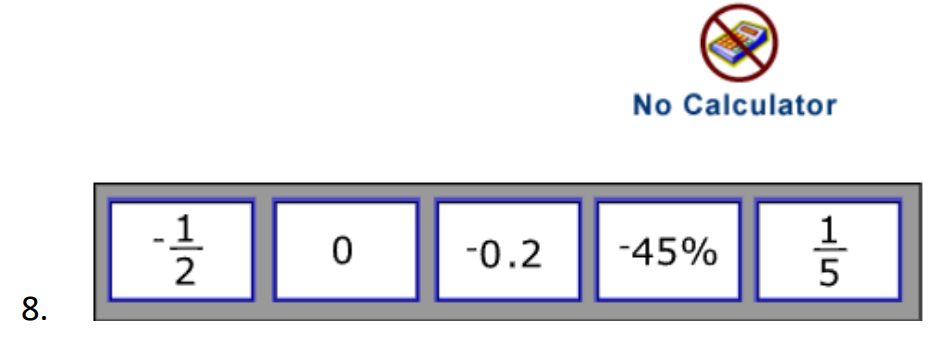
Drag and drop the angle measurements to the correct place.
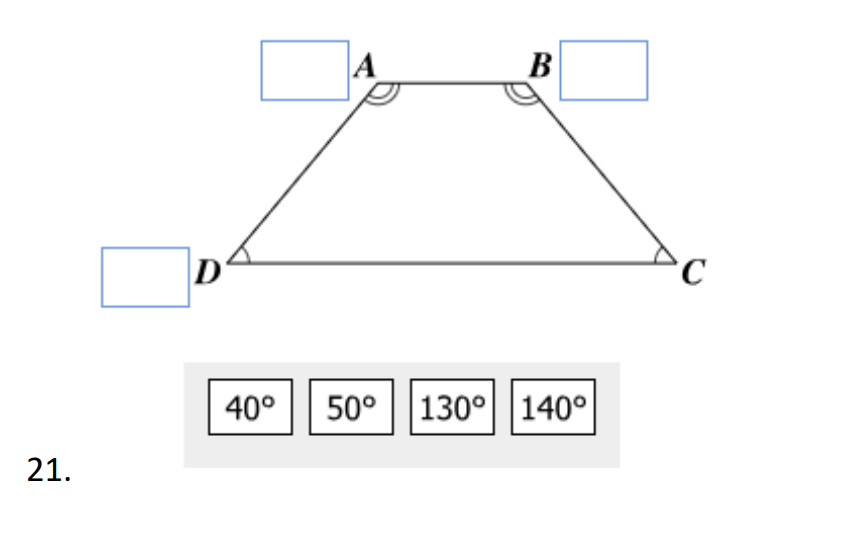
40
130
140
50
Plot your points for E' F' and G'
Plot two points. Do NOT plot (-1, -2)
Do not use spaces in your answer.
Do not use spaces in your answer.
Drag and drop the the answer to the correct box.
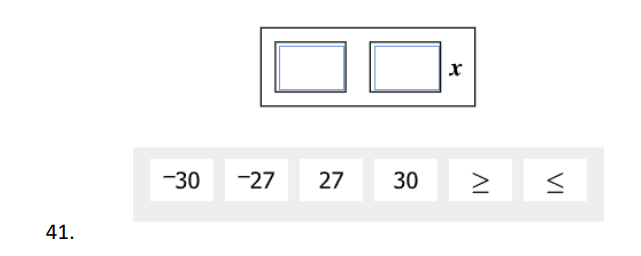

-27
-30

Select the correct endpoint
Use the / for your fraction bar. No spaces.
Select the correct answers.
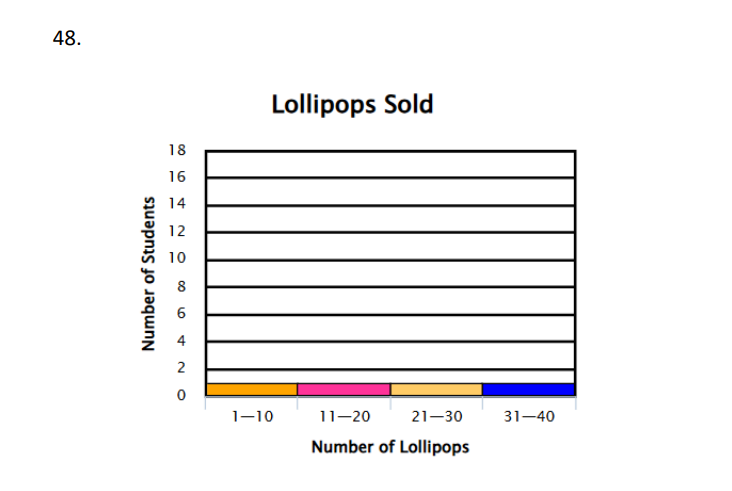
What is the number of students who received 1-10 lollipops?
What is the number of students who received 11-20 lollipops?
What is the number of students who received 21-30 lollipops?
Do not use spaces in your answer
Do not use spaces in your answer.
What is the number of students who received 31-40 lollipops?