Coral Reef Energy Flow and Matter Cycling
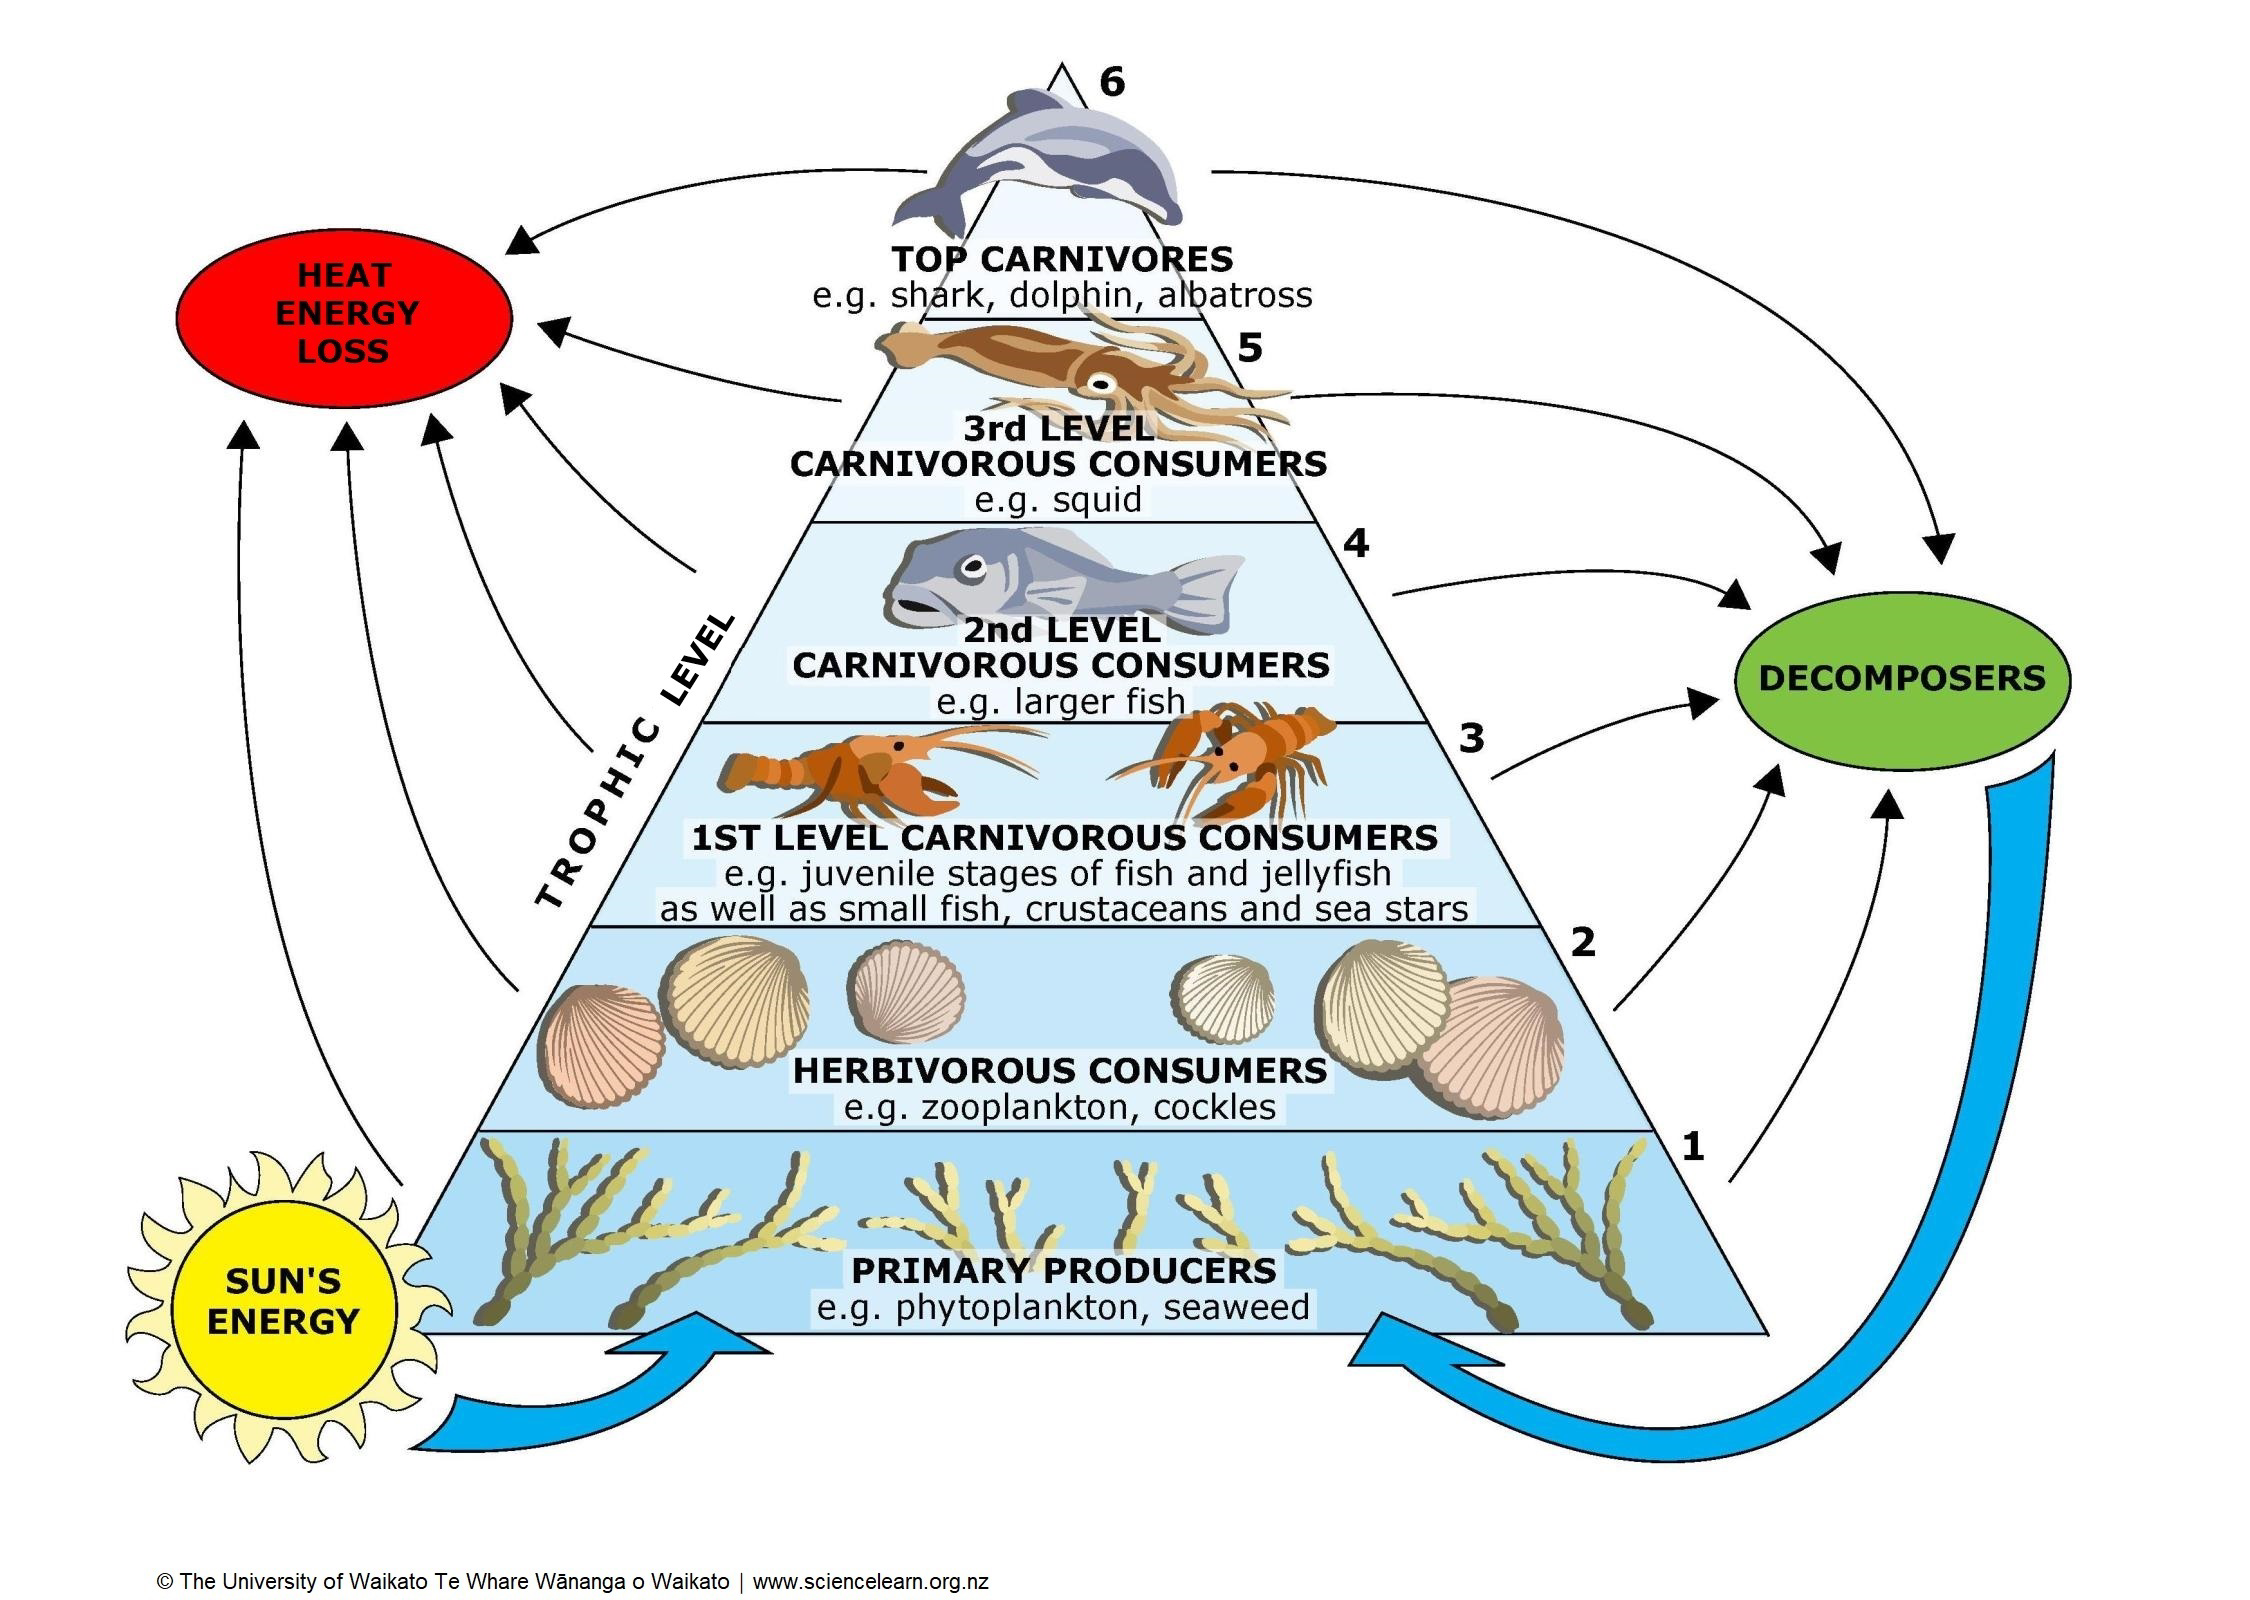
Diagram 1.
Source: https://www.sciencelearn.org.nz/topics/fish
Coral reefs are among the most productive ecosystems on Earth. Even though they occupy less than 1%
of the ocean floor, they support over 25% of all marine life. This high productivity comes from fast-growing
algae that harness abundant sunlight and warm temperatures to fix carbon rapidly. These algae form the
energetic foundation of the coral reef food web, making reefs an ideal real-world model.
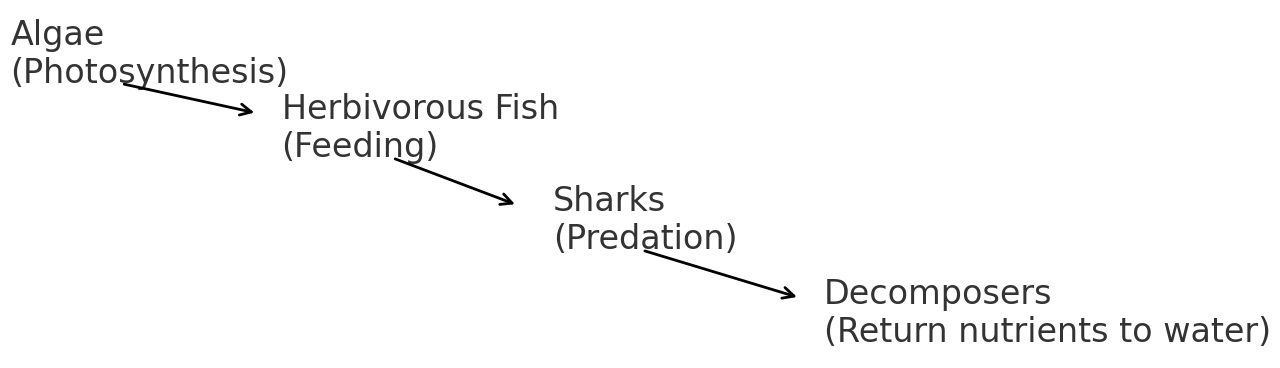
Algae perform photosynthesis, converting carbon dioxide into energy-rich organic molecules. The stored
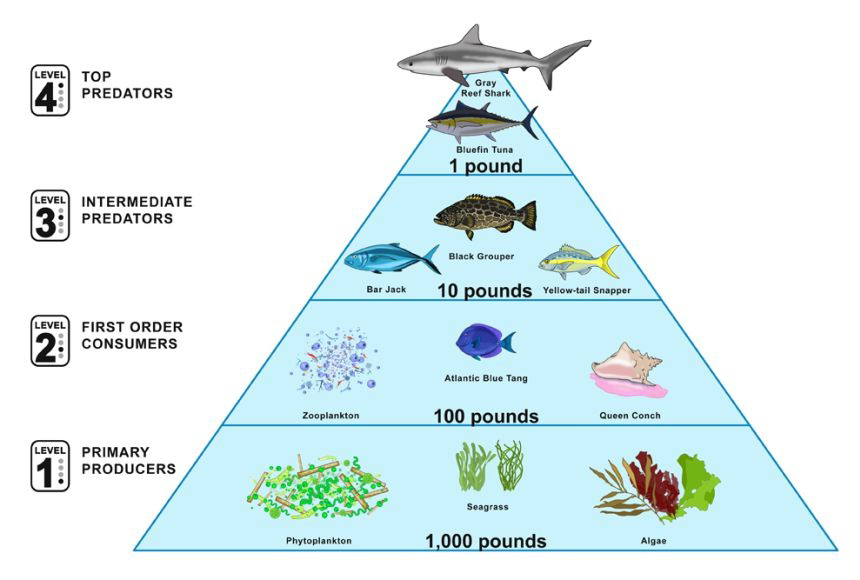
energy becomes available to herbivorous fish such as parrotfish, surgeonfish, and damselfish. Mathematical patterns in coral reef energy flow show that algae contain approximately 1500 kJ/m²/day, while herbivorous fish only retain about 160 kJ/m²/day of this energy after feeding. This follows the familiar pattern where roughly 10% of energy transfers to the next trophic level, due to heat loss and metabolic activity.
At the top of the food chain, sharks obtain only a fraction of the energy stored at lower levels. These
apex predators may retain as little as 18 kJ/m²/day, demonstrating a sharp decline in energy availability with
each transfer. This decline explains why shark populations are far smaller than herbivorous fish populations and
why coral reefs require enormous algal productivity to support even a modest number of large predators.
Matter cycling, however, tells a different story. Carbon, nitrogen, and phosphorus move repeatedly
through algae, fish, sharks, and decomposers. When organisms excrete waste or die, decomposers return mineral nutrients to the water, where they once again support algal growth. This creates a continuous recycling of
essential atoms even while energy flows one way and dissipates as heat.
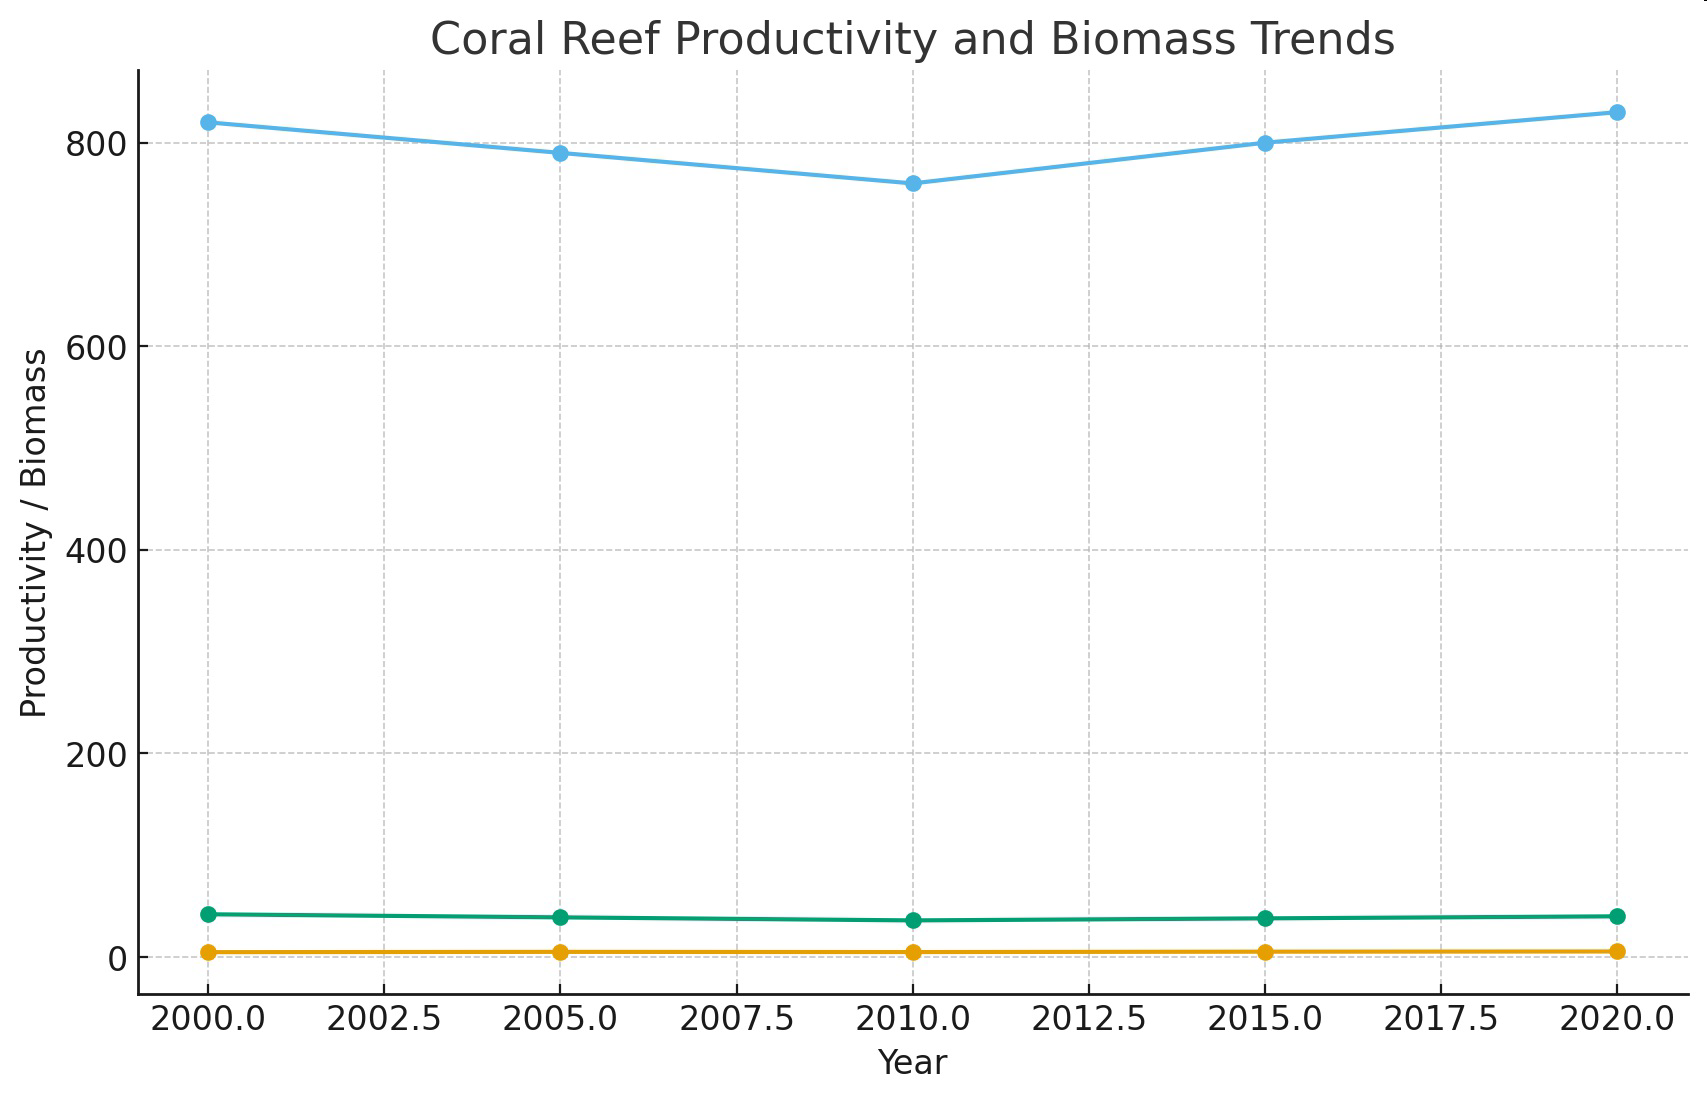
Long-term coral reef monitoring also reveals predictable mathematical patterns. As algal productivity
rises or falls slightly across years, herbivorous fish biomass and shark biomass change proportionally. These
trends reflect the tight coupling of producer productivity with consumer populations, supporting the HS-LS2-4
requirement to use mathematical representations - such as graphs, ratios, and energy pyramids - to justify
claims about matter cycling and energy flow.
Coral reefs therefore serve as a clear, data-supported example: matter cycles, but energy flows and
decreases, shaping population size, productivity, and ecological stability.
Diagram 2.
 Source: https://images.nationalgeographic.org/image/upload/t_edhub_resource_key_image/v1652340623/EducationHub/photos/
Diagram 3.
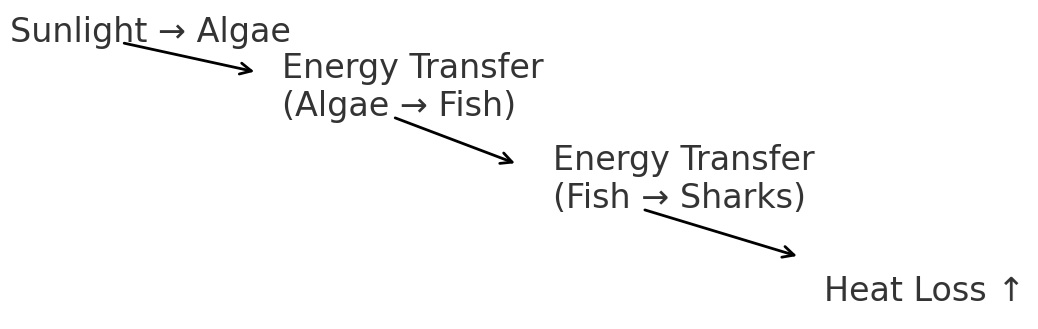
Table 1.
Trophic Level | Energy Available kJ/m²/day |
|---|
Algae (Producers) | 1500 |
Herbivorous Fish | 160 |
Sharks (Top Predators) | 18 |
Graph of Information - Figure 1.
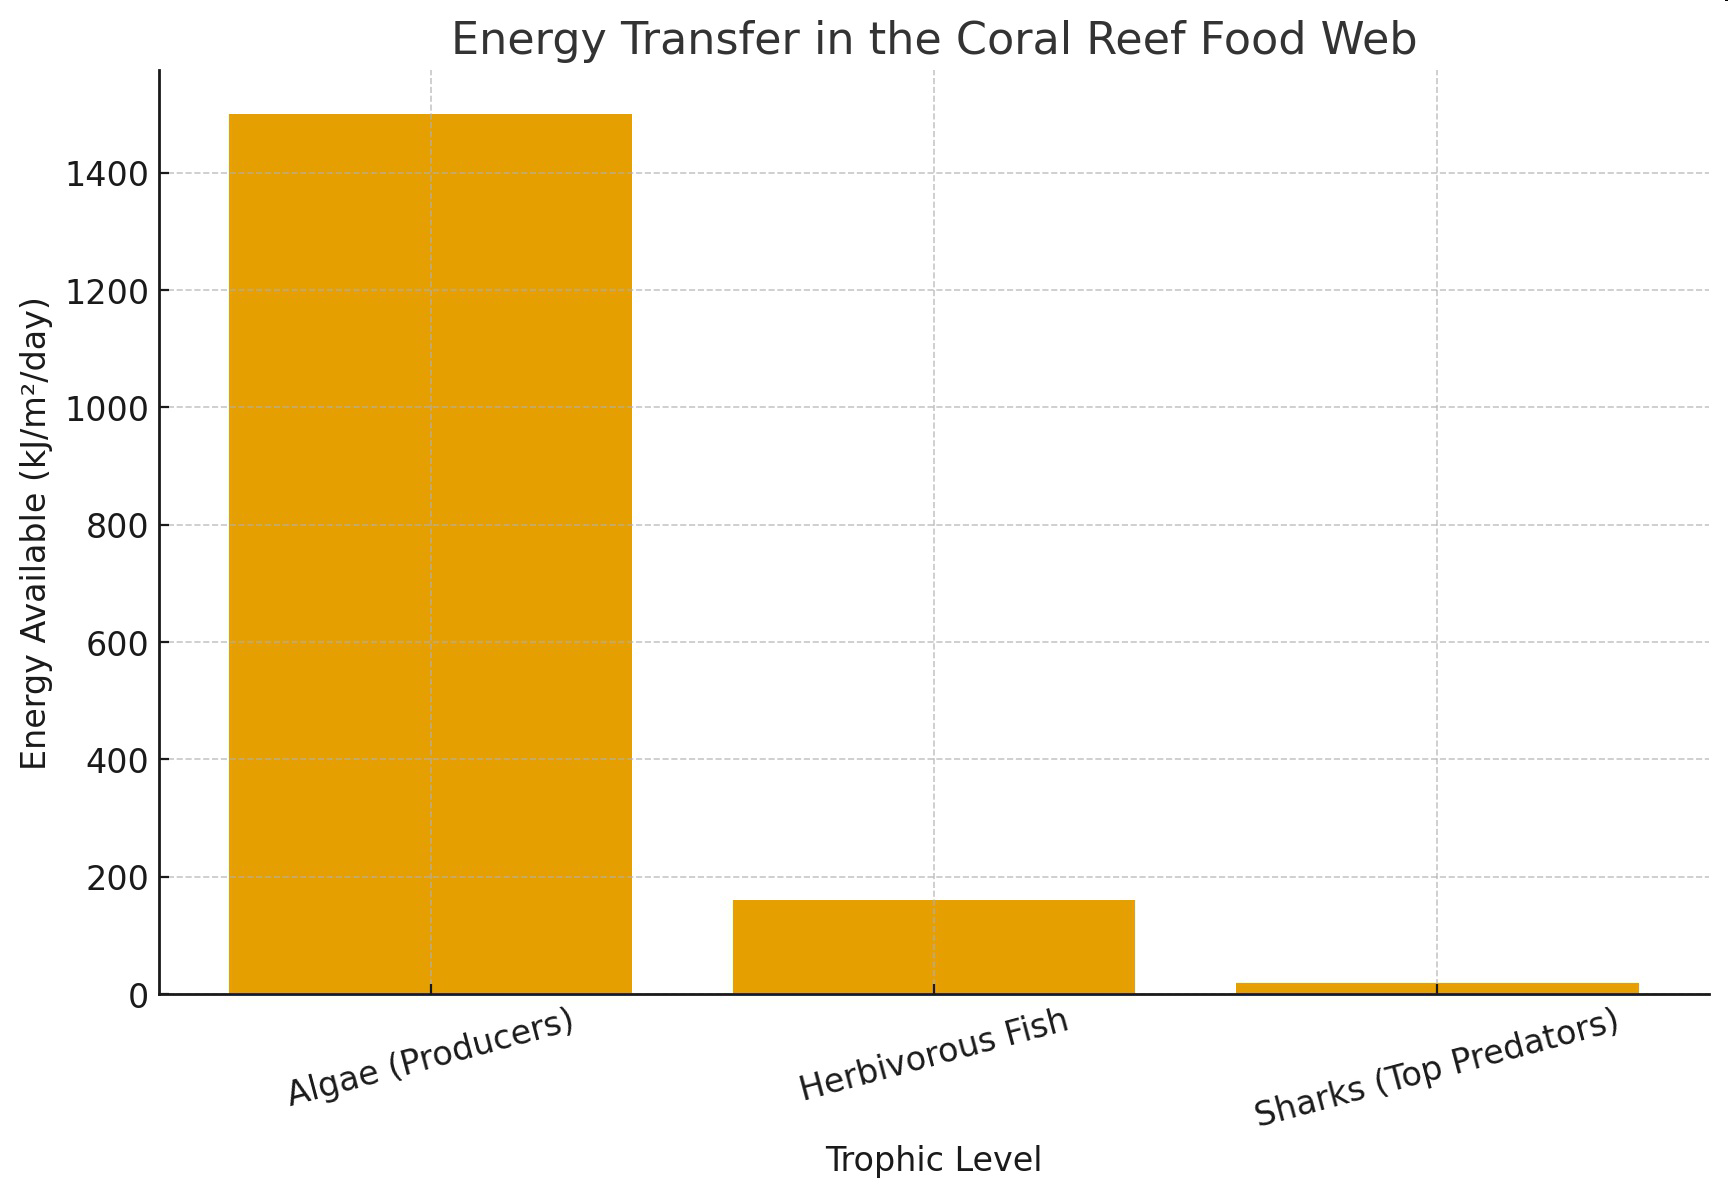
Table 2.
Year | Algal Productivity gC/m²/day | Herbivorous Fish Biomass kg/ha | Shark Biomass kg/ha |
|---|
2000 | 4.8 | 820 | 42 |
2005 | 5.1 | 790 | 39 |
2010 | 4.9 | 760 | 36 |
2015 | 5.3 | 800 | 38 |
2020 | 5.5 | 830 | 40 |
Graph of Information - Figure 2.