Ɛhia
1
Ɛhia
1
Ɛhia
1
Using your graphics display calculator, find the X2-statistic
Using your graphics display calculator, find the X2-statistic
Ɛhia
1
Ɛhia
1
Ɛhia
3
Using your graphics display calculator, find the X2-statistic
State the null hypotheses.
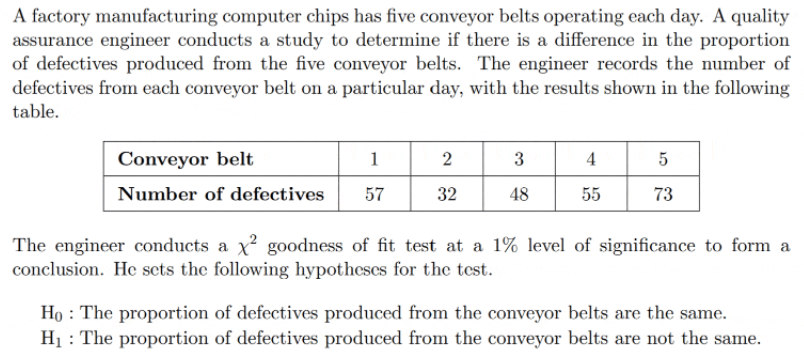
Estimate the number of defectives produced from each conveyor belt if the number of defects are evenly distributed.
Write down the number of degrees of freedom.
and p-value.
Do we reject the null hypothesis?
Provide a reason for your conclusion.
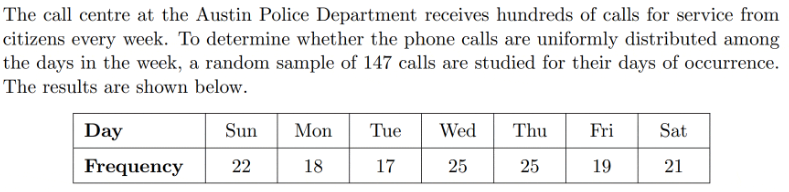
Complete the table with the expected frequencies, on the assumption that each day should be equally proportional in calls received.
A X2 goodness of fit test is performed at a 5% significance level.
State the null hypotheses.
State the alternate hypotheses.
Write down the number of degrees of freedom.
Using your graphics display calculator, find the X2-statistic
and p-value.
The critical value is 12.592. Determine the conclusion for the test.
providing a reason.
State the alternate hypotheses.
Write down the number of degrees of freedom.
Calculate the p-value for the test.
Determine the conclusion for the test.
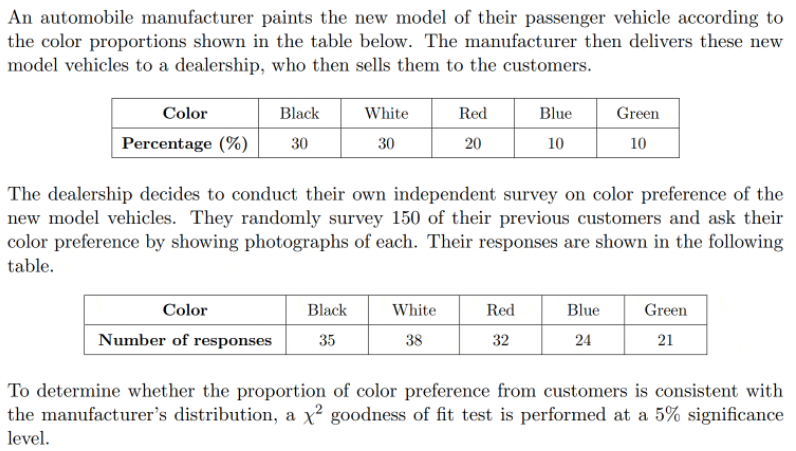
Determine if the manufacturer should consider changing the color distribution of their new model vehicles to be delivered to the dealership, to be more consistent with customer preferences.
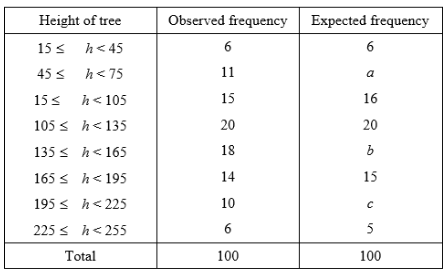
In a reforested area of pine trees, heights of trees planted in a specific year seem to follow a normal distribution with mean 133.5 and standard deviation 56.3. A sample of 100 such trees is selected to test the validity of this hypothesis, using a 5% level of significance. The results of measuring tree heights, to the nearest centimeter, are recorded in the first two columns of the table below.
State the null hypothesis.
State the alternate hypothesis.
Most of the expected frequencies have been calculated in the third column. (Frequencies have been rounded to the nearest integer, and frequencies in the first and last classes have been extended to include the rest of the data beyond 15 and 225.
Find the value of a. Round your answer to an integer.
Find the value of b. Round your answer to an integer.
Find the value of c. Round your answer to an integer.
Given that there are 5 degrees of freedom, find the p-value.
Do we reject the null hypothesis?
Provide a reason for your conclusion.