1
1
1
1
1
1
1
1
1
I will know I am successful when:
*I can remember what I have learned about Expressions & Inequalities to be ready for RISE.
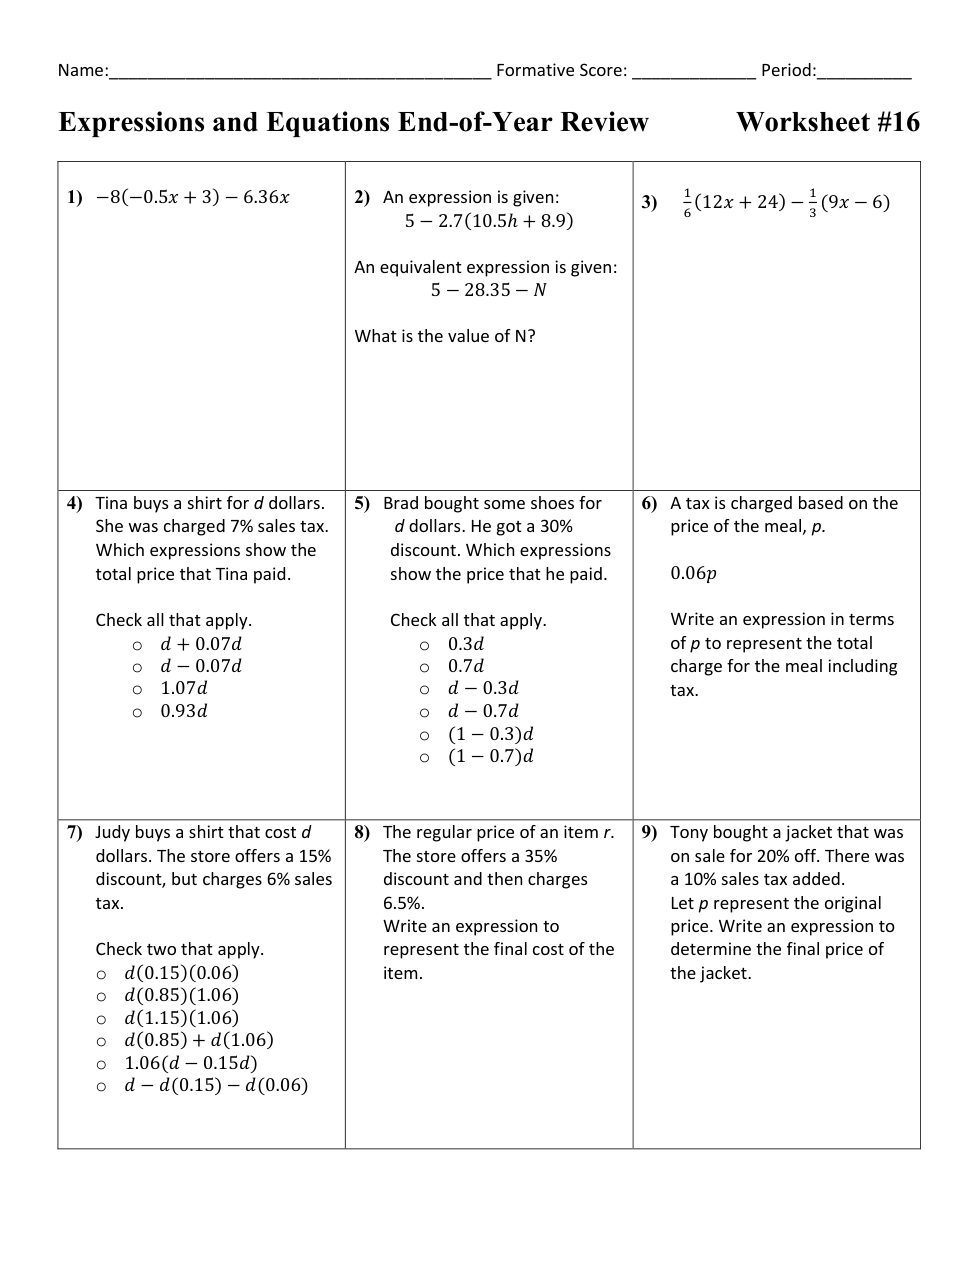
Write the expression in simplest form.
What is the value of N?
Write the expression in simplest form.
Select all that apply.
Select all that apply.
Write an expression in terms of p to represent the total charge for the meal including tax.
Check two that apply
Write an expression to represent the final cost of the item.
Write an expression to determine the final price of the jacket.
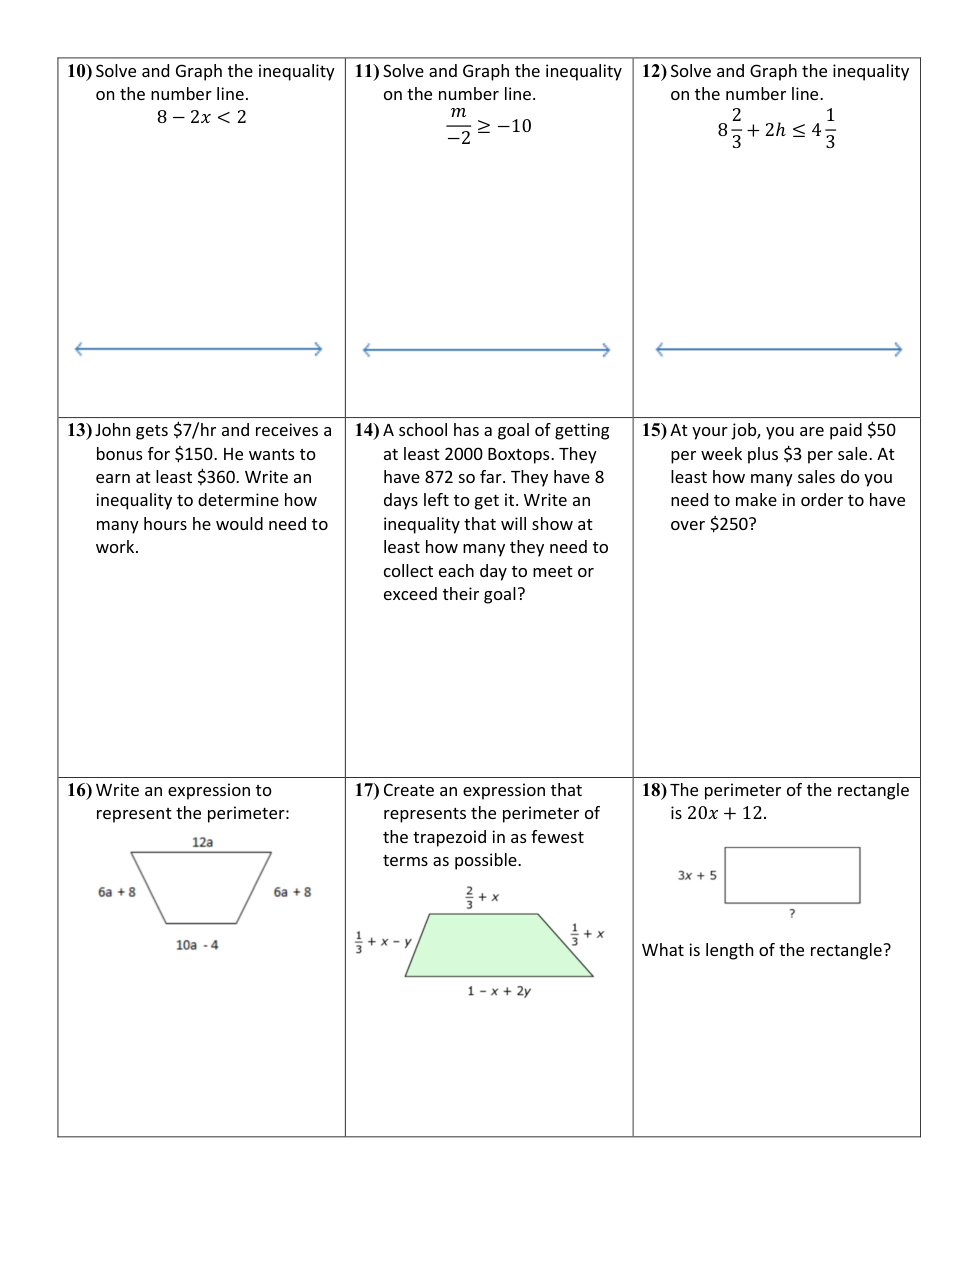
Write the solution to your inequality like:
Graph your solution from above.
Write the solution to your inequality like:
Graph your solution from above.
Write the solution to your inequality like:
rounded to the nearest tenth.
Write an inequality to determine how many hours he would need to work? Use x as your variable.
Write an inequality that will show at least how many they need to collect each day to meet or exceed their goal? Use x as your variable
Write an inequality to show at least how many sales you need to make in order to have over $250? Use x as your variable.
Write an expression in simplest form to represent the perimeter.
Create an expression that represents the perimeter of the trapezoid in as fewest terms as possible.
What is the length of the rectangle?