Wolf Reintroduction in Yellowstone
Diagram 1.
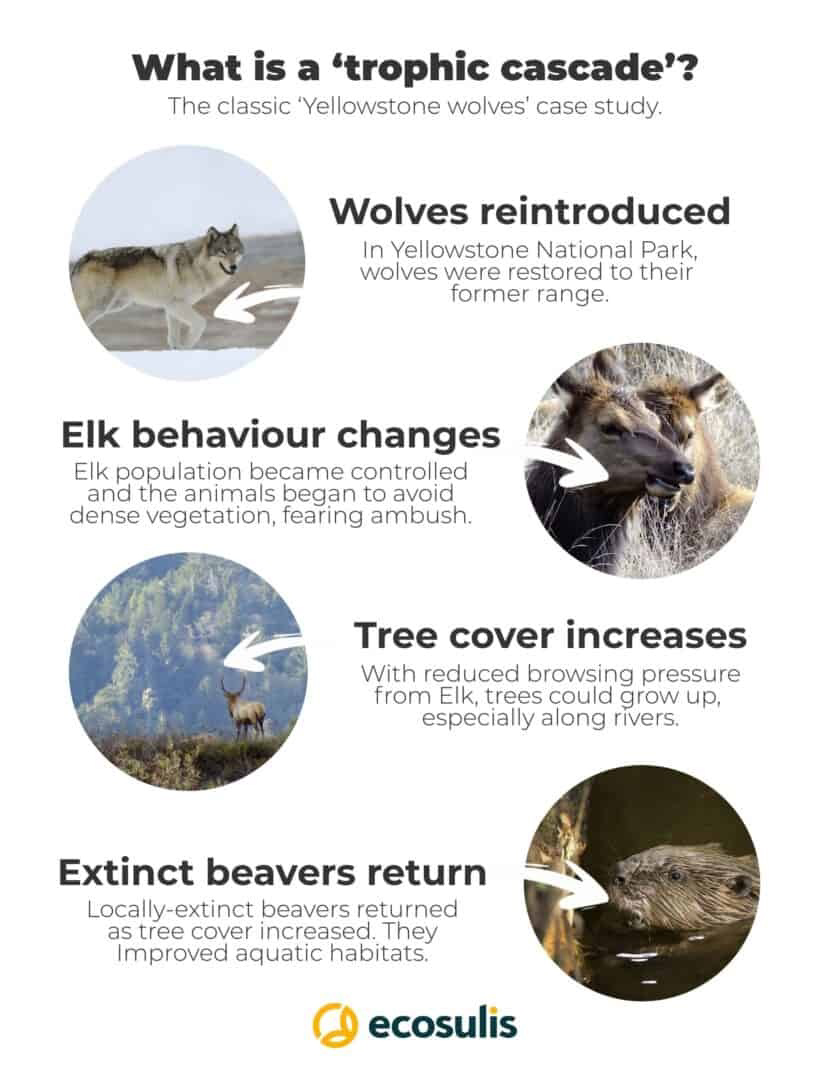 Source: https://ecosulis.co.uk/blog/rewilding-trophic-cascades-landscapes-of-fear/
When wolves were reintroduced to Yellowstone National Park in 1995 after a 70-year absence, scientists witnessed one of the most well-documented trophic cascades in ecology. A trophic cascade occurs when changes at one trophic level – such as the top predator – spread throughout the entire food web, altering energy flow, matter cycling, and ecosystem structure.
Before wolves returned, elk populations had grown very large. With no major predators, elk browsed heavily on young willow and aspen. This reduced plant biomass, limited soil nutrient retention, and decreased habitat for beavers, songbirds, and many other species. Much of the system’s energy flow was trapped between only two trophic levels: plants – elk. Little energy or biomass reached upper levels because wolves were missing.
When wolves returned, elk behavior and numbers began to change. Wolves hunted elk, reducing the elk population and causing elk to move more frequently and avoid high-risk areas like riverbanks. With fewer elk feeding in these areas, young willow and aspen began to grow again. More plant biomass meant greater carbon storage, increased photosynthesis, and more energy available to primary consumers.
As vegetation returned, beavers benefited. They rely heavily on willow for food and building material. Beaver colonies expanded dramatically, creating ponds and wetlands that increased nutrient cycling, trapped sediment, and provided habitat for fish, amphibians, and birds. Songbird populations increased as shrubs and young trees provided shelter and food.
Even streambanks became more stable. Deep-rooted vegetation prevented erosion, improving water flow. The entire ecosystem reorganized as energy was transferred through more trophic levels and matter cycled more efficiently through producers, herbivores, carnivores, decomposers, and soil.
Diagram 2.
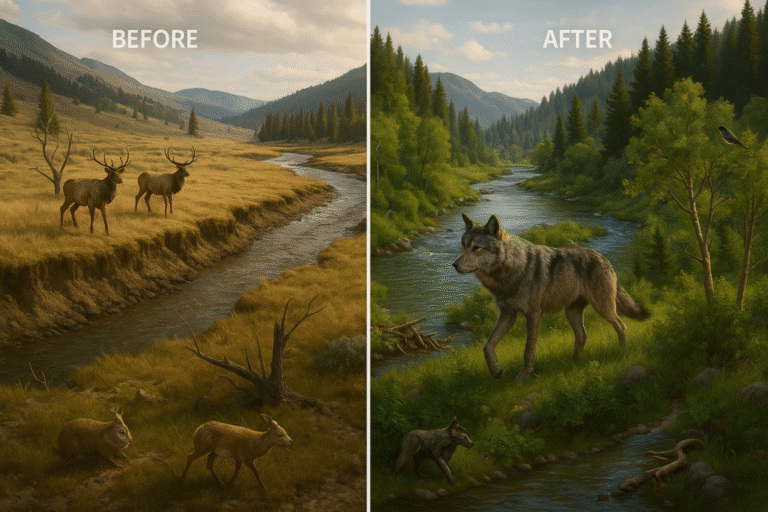 Source: https://www.greenlivinganswers.com/ecosystem/trophic-cascade
Table 1.
Year | Wolf Population | Elk Population | Willow Biomass (kg/ha) |
|---|
1995 | 21 | 16000 | 220 |
2000 | 70 | 12000 | 380 |
2005 | 110 | 9000 | 520 |
2010 | 96 | 7000 | 710 |
2015 | 83 | 6000 | 900 |
2020 | 95 | 6500 | 1040 |
Graph of Information - Figure 1.
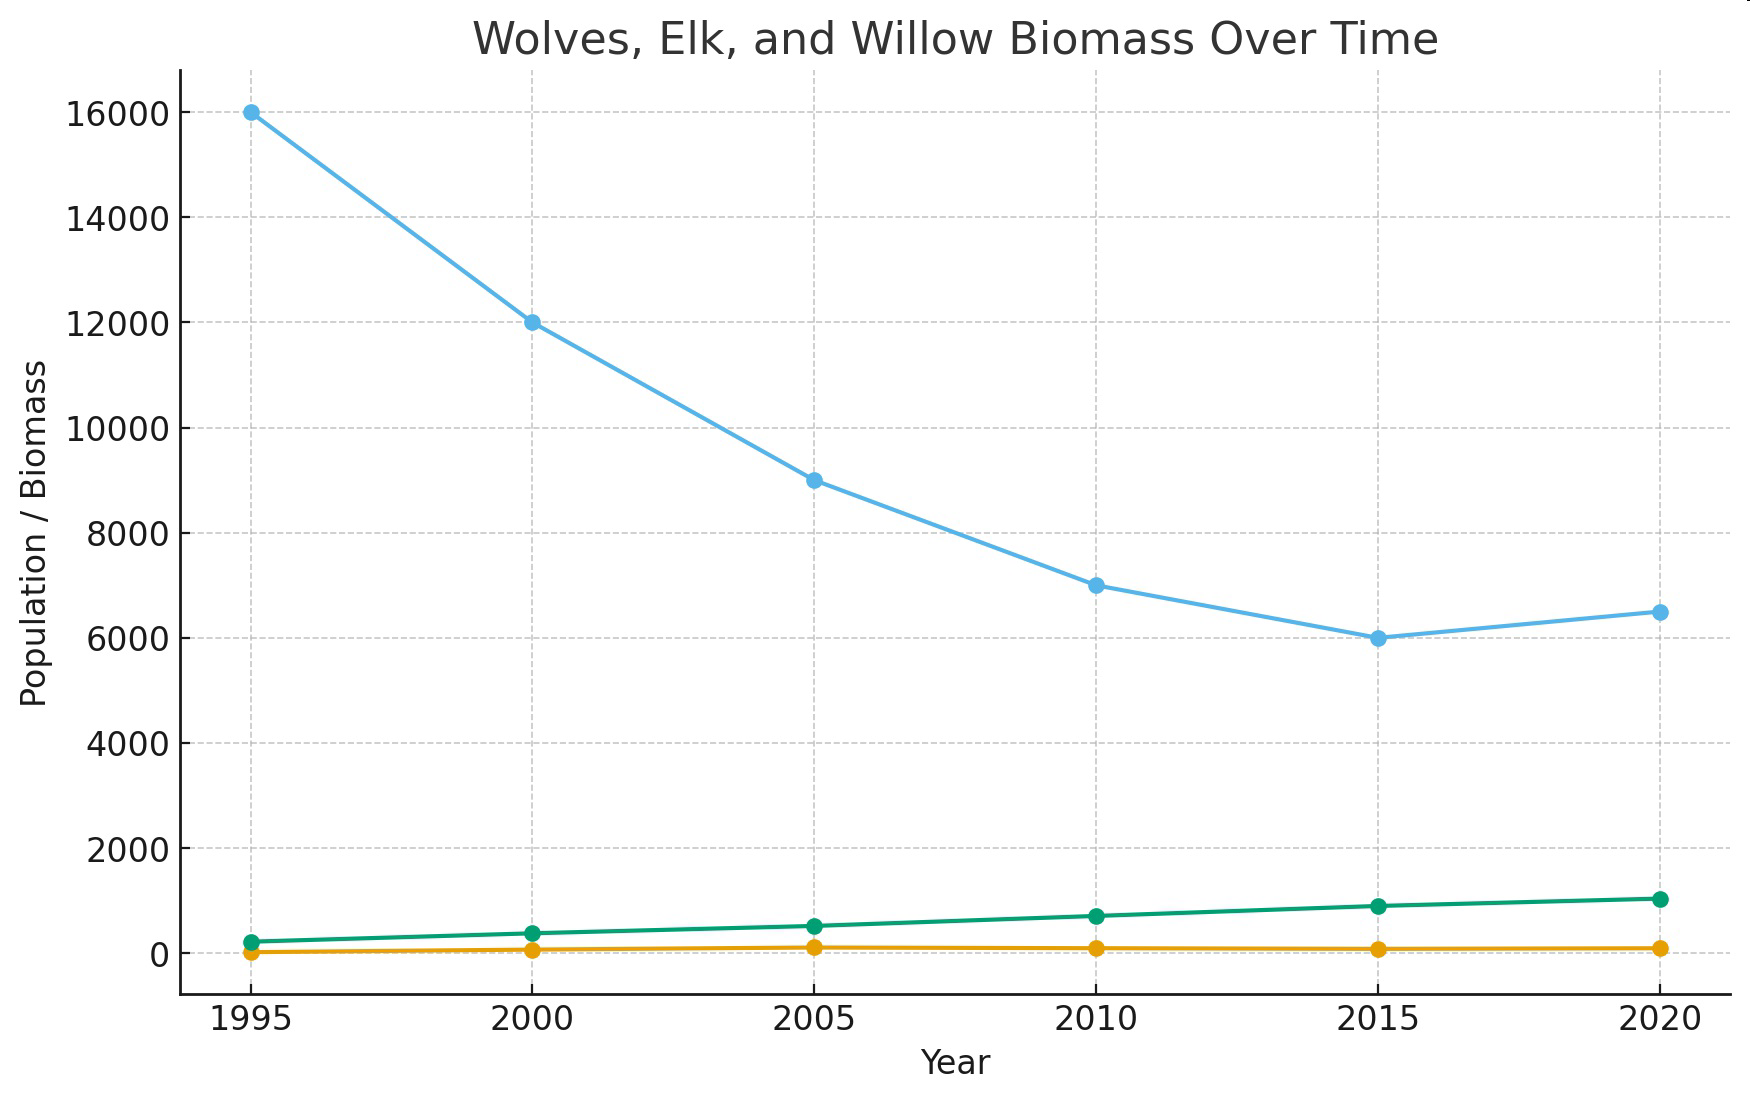
Table 2.
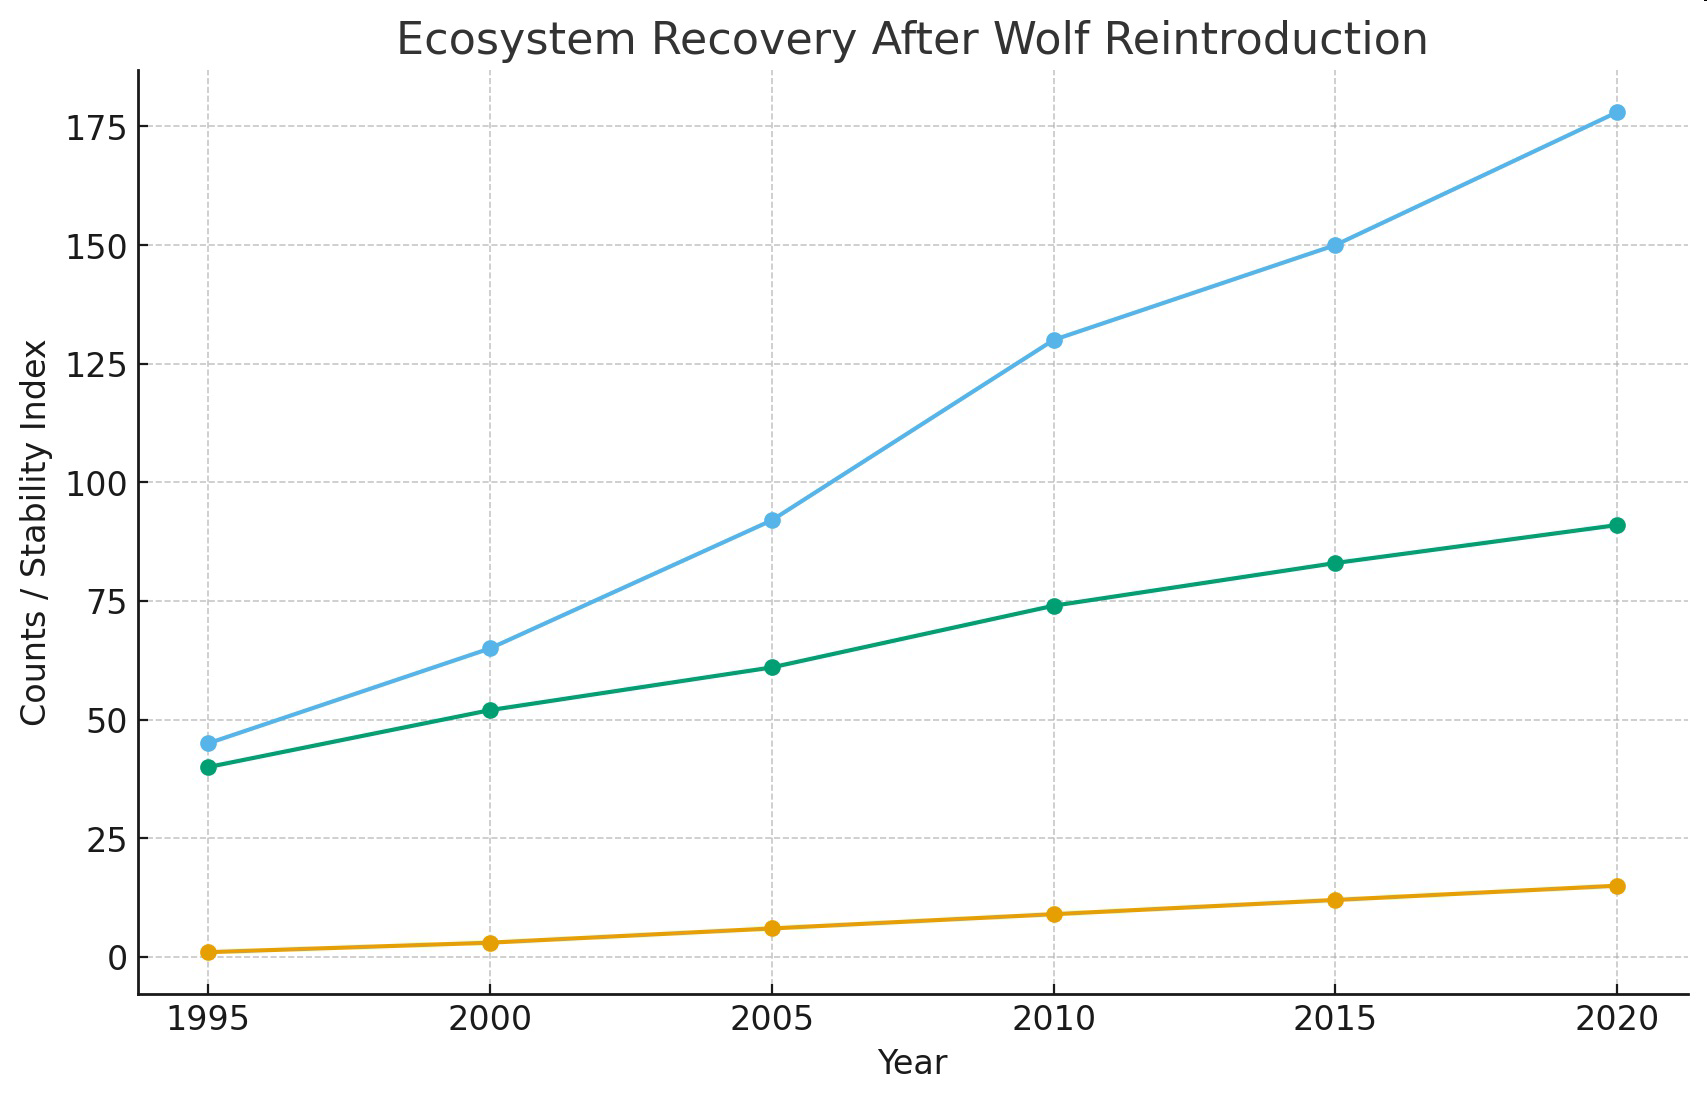
Year | Beaver Colonies | Songbird Counts | Streambank Stability Index |
|---|
1995 | 1 | 45 | 40 |
2000 | 3 | 65 | 52 |
2005 | 6 | 92 | 61 |
2010 | 9 | 130 | 74 |
2015 | 12 | 150 | 83 |
2020 | 15 | 178 | 91 |
Graph of Information - Figure 2.