Heat-Tolerant Corals in Warming Reefs
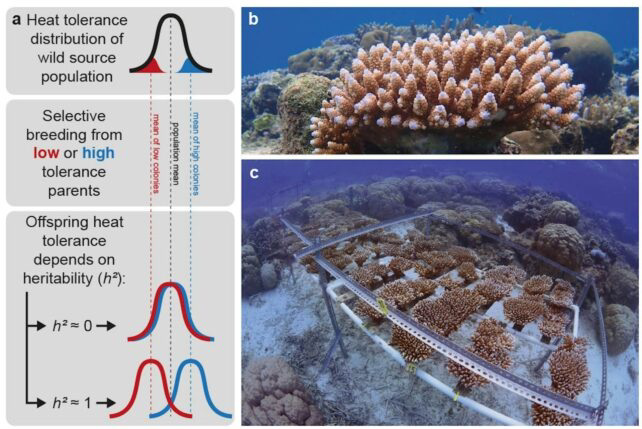
Coral reefs are experiencing increasing thermal stress as global ocean temperatures rise. Corals depend on a mutualistic relationship with photosynthetic algae called zooxanthellae, which provide both nutrients and color. When water temperatures become too warm, corals expel their algae, resulting in bleaching and, if prolonged, death. However, not all corals respond the same way. Some individuals within a species possess heritable traits that make them more tolerant of heat stress. Over time, as bleaching events increase in frequency and severity, these heat-tolerant individuals tend to survive and reproduce at higher rates than their less tolerant counterparts.
Heat tolerance in corals is influenced by both their own genetic traits and the type of symbiotic algae they host. Certain coral genotypes produce more protective proteins, stabilize photosynthesis under stress, or maintain cellular functions at higher temperatures. Likewise, some strains of symbiotic algae are better adapted to warm water. When corals inherit combinations of these traits, they are more capable of surviving bleaching events.
Diagram 1.
Source: https://www.sciencealert.com/heat-tolerant-corals-can-better-survive-marine-heatwaves-study-shows
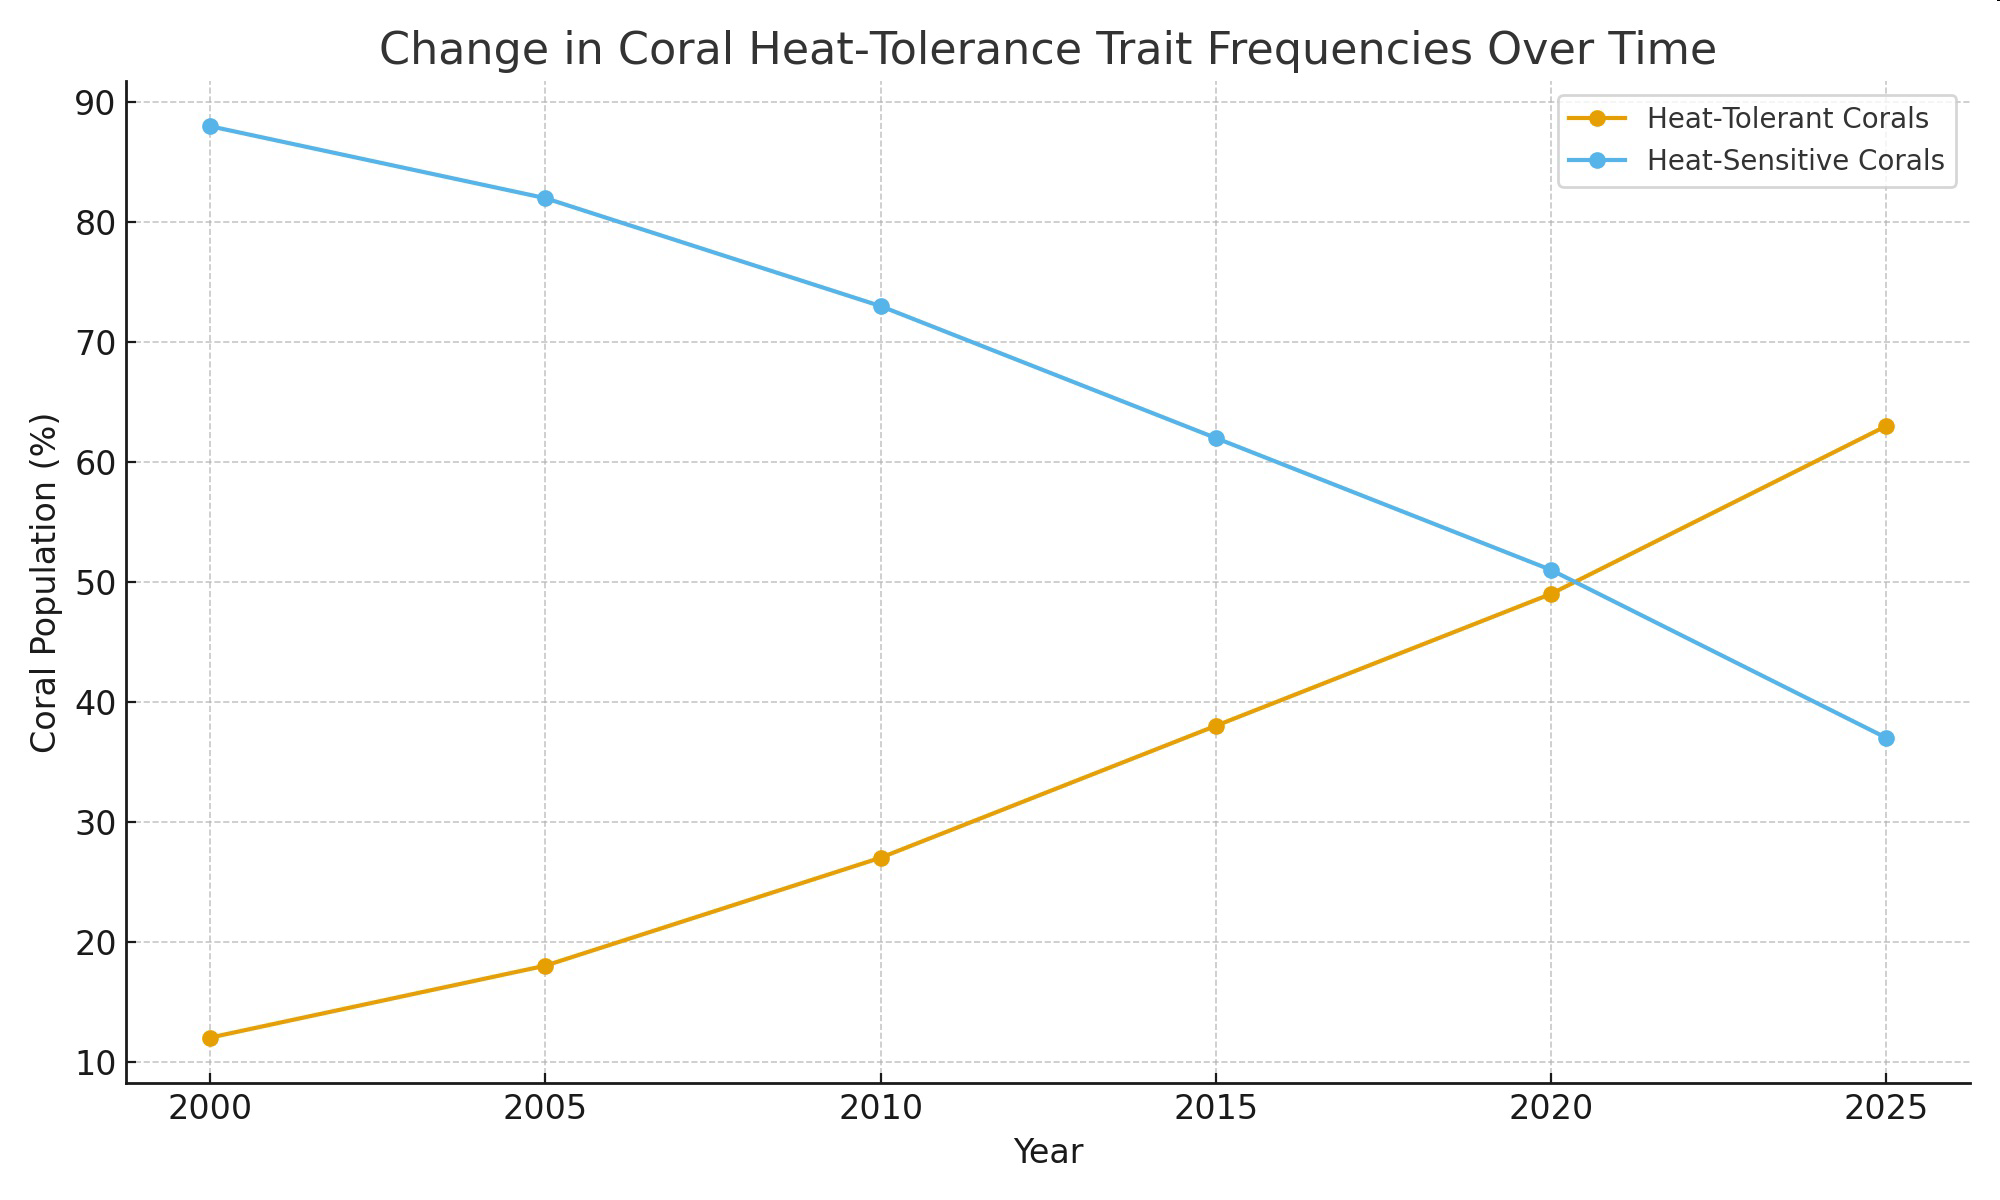
As reefs experience repeated warming episodes, scientists have documented shifts in population composition. Before major heatwaves, coral populations typically contain a wide range of tolerance levels. After a heatwave, susceptible individuals die at higher rates, leaving behind a greater proportion of heat-tolerant corals. Over generations, this leads to a measurable increase in the frequency of heat-tolerant genotypes in the population.
Researchers quantify these changes by measuring coral survival rates under stress, tracking the frequencies of tolerant versus susceptible phenotypes, and analyzing the probability that traits will be passed on. Heat-tolerant corals that survive bleaching events not only persist but also produce more offspring than susceptible individuals, increasing the representation of tolerance traits in each subsequent generation.
Diagram 2.
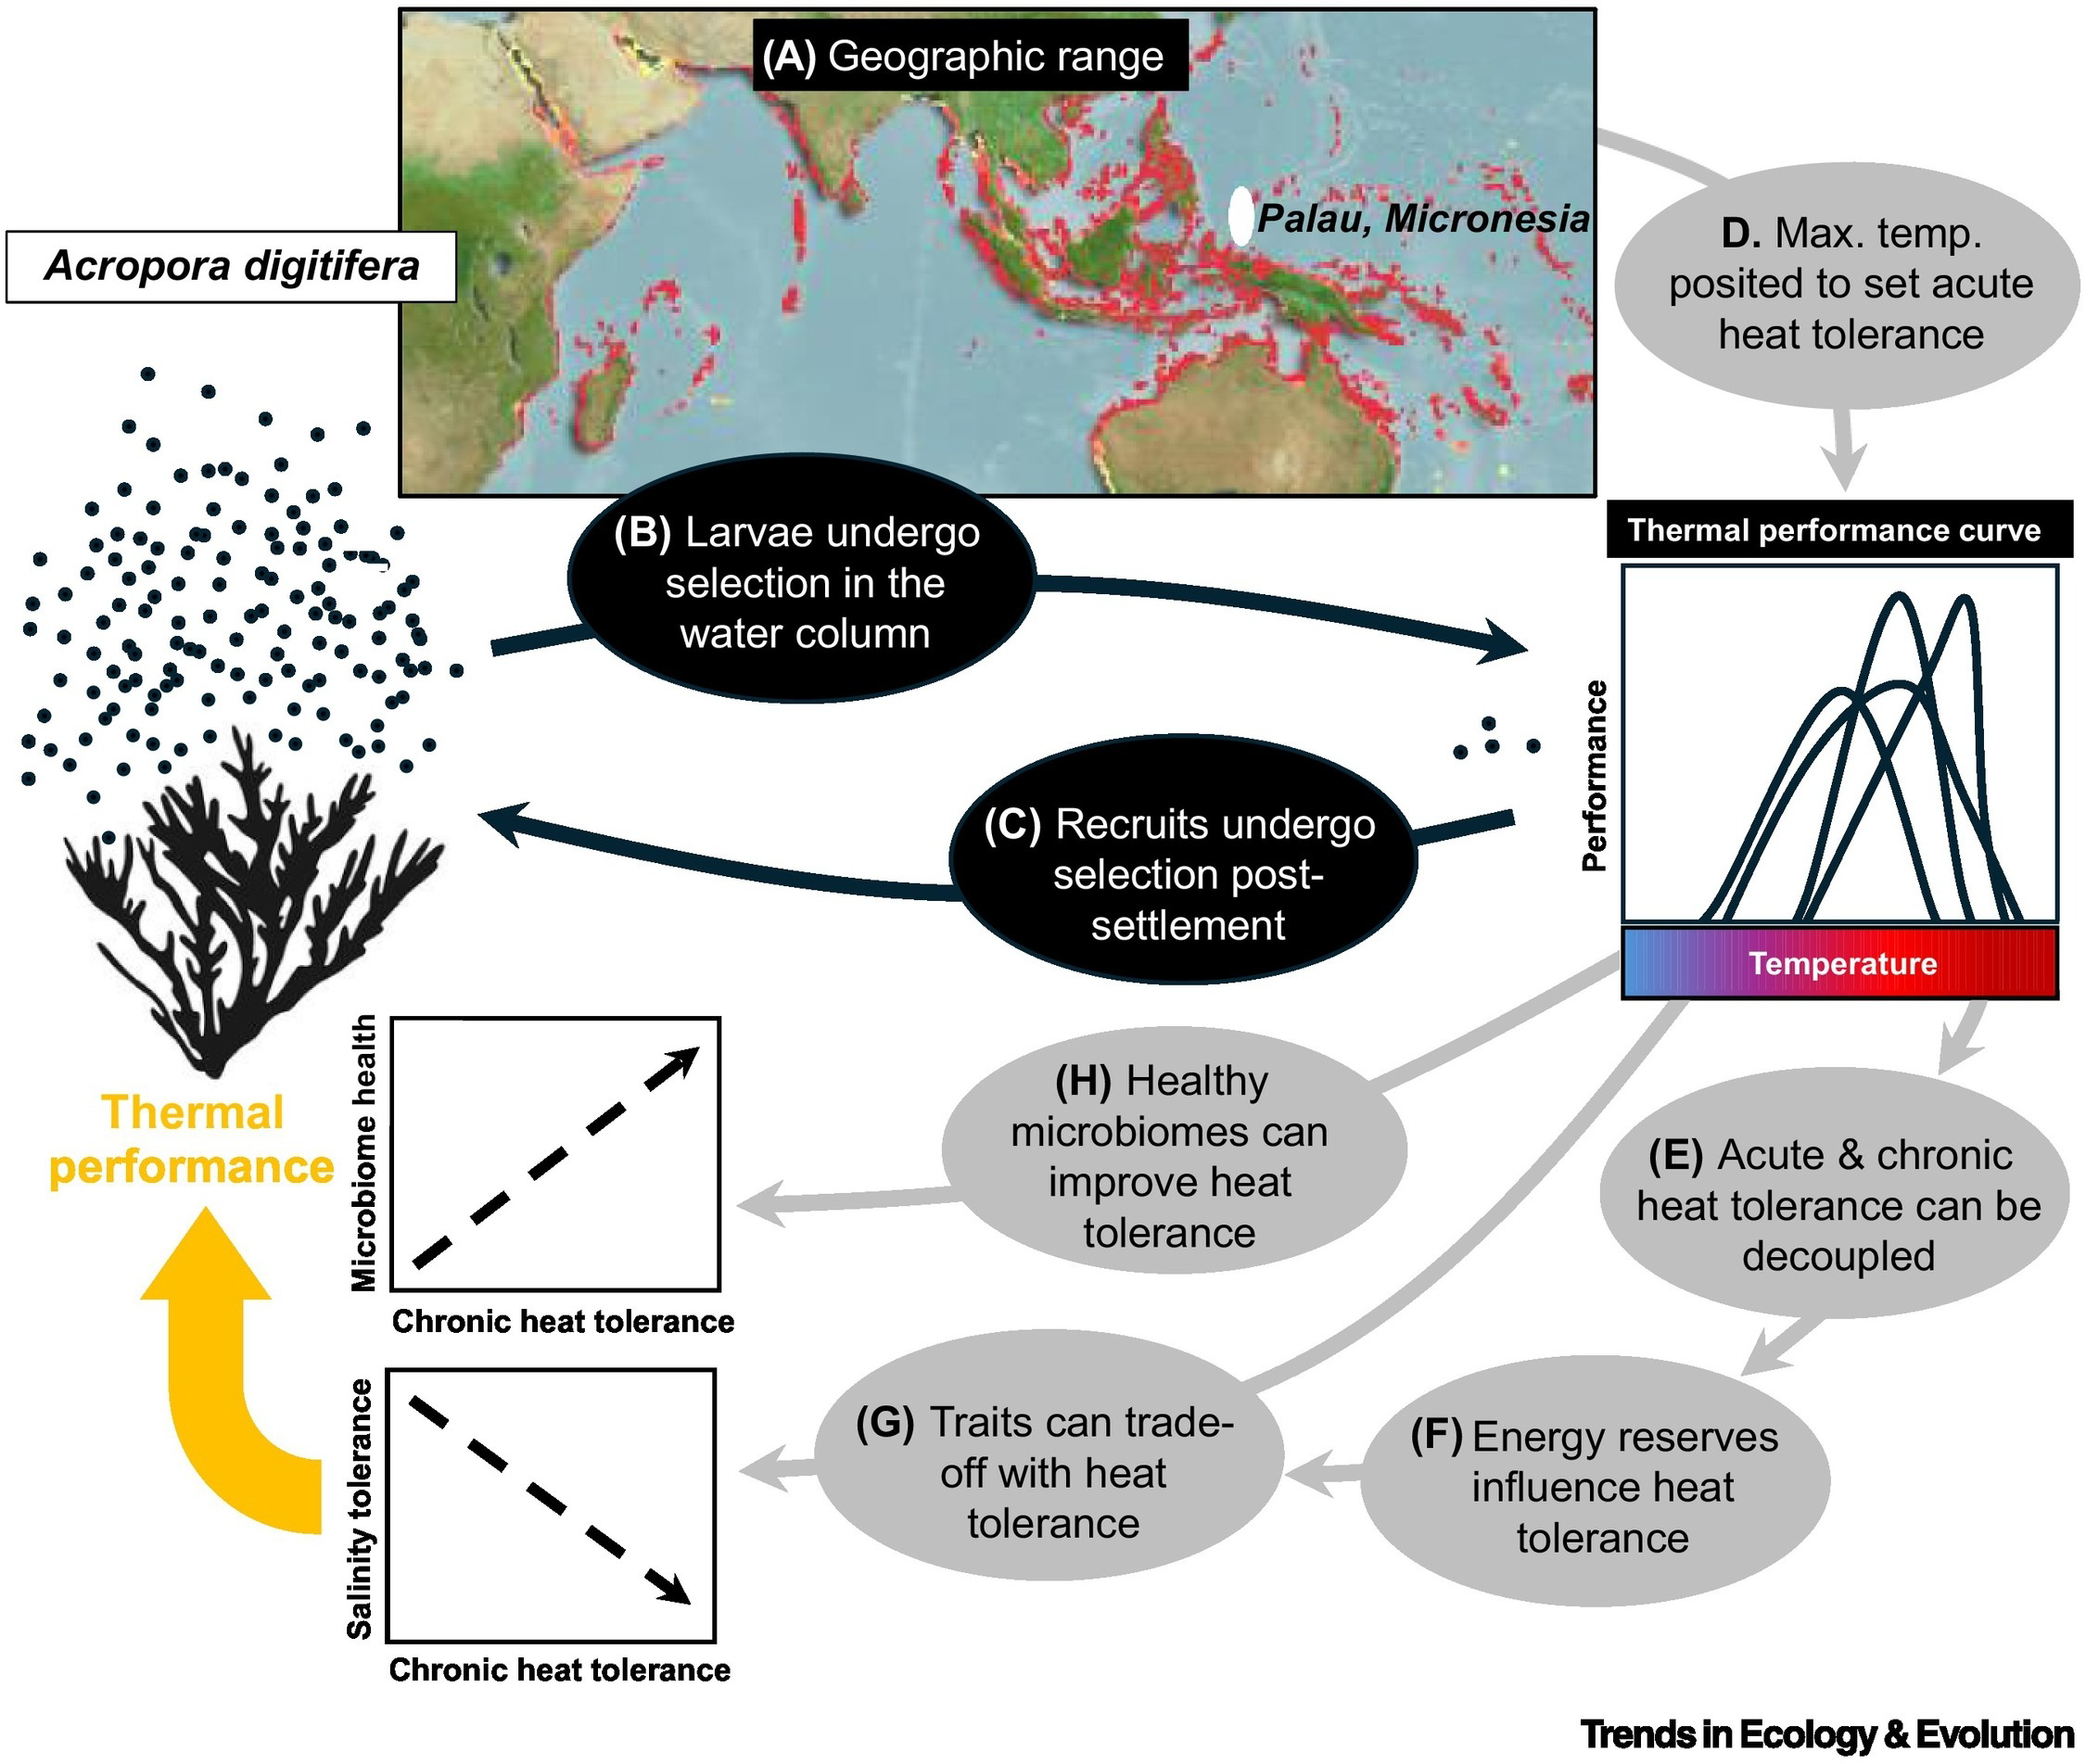
Table 1.
Year | Heat Tolerant Corals (%) | Heat Sensitive Corals (%) |
|---|
2000 | 12 | 88 |
2005 | 18 | 82 |
2010 | 27 | 73 |
2015 | 38 | 62 |
2020 | 49 | 51 |
2025 | 63 | 37 |
Graph of Information - Figure 1.
 Source:
https://www.cell.com/trends/ecology-evolution/abstract/S0169-5347(24)00273-8
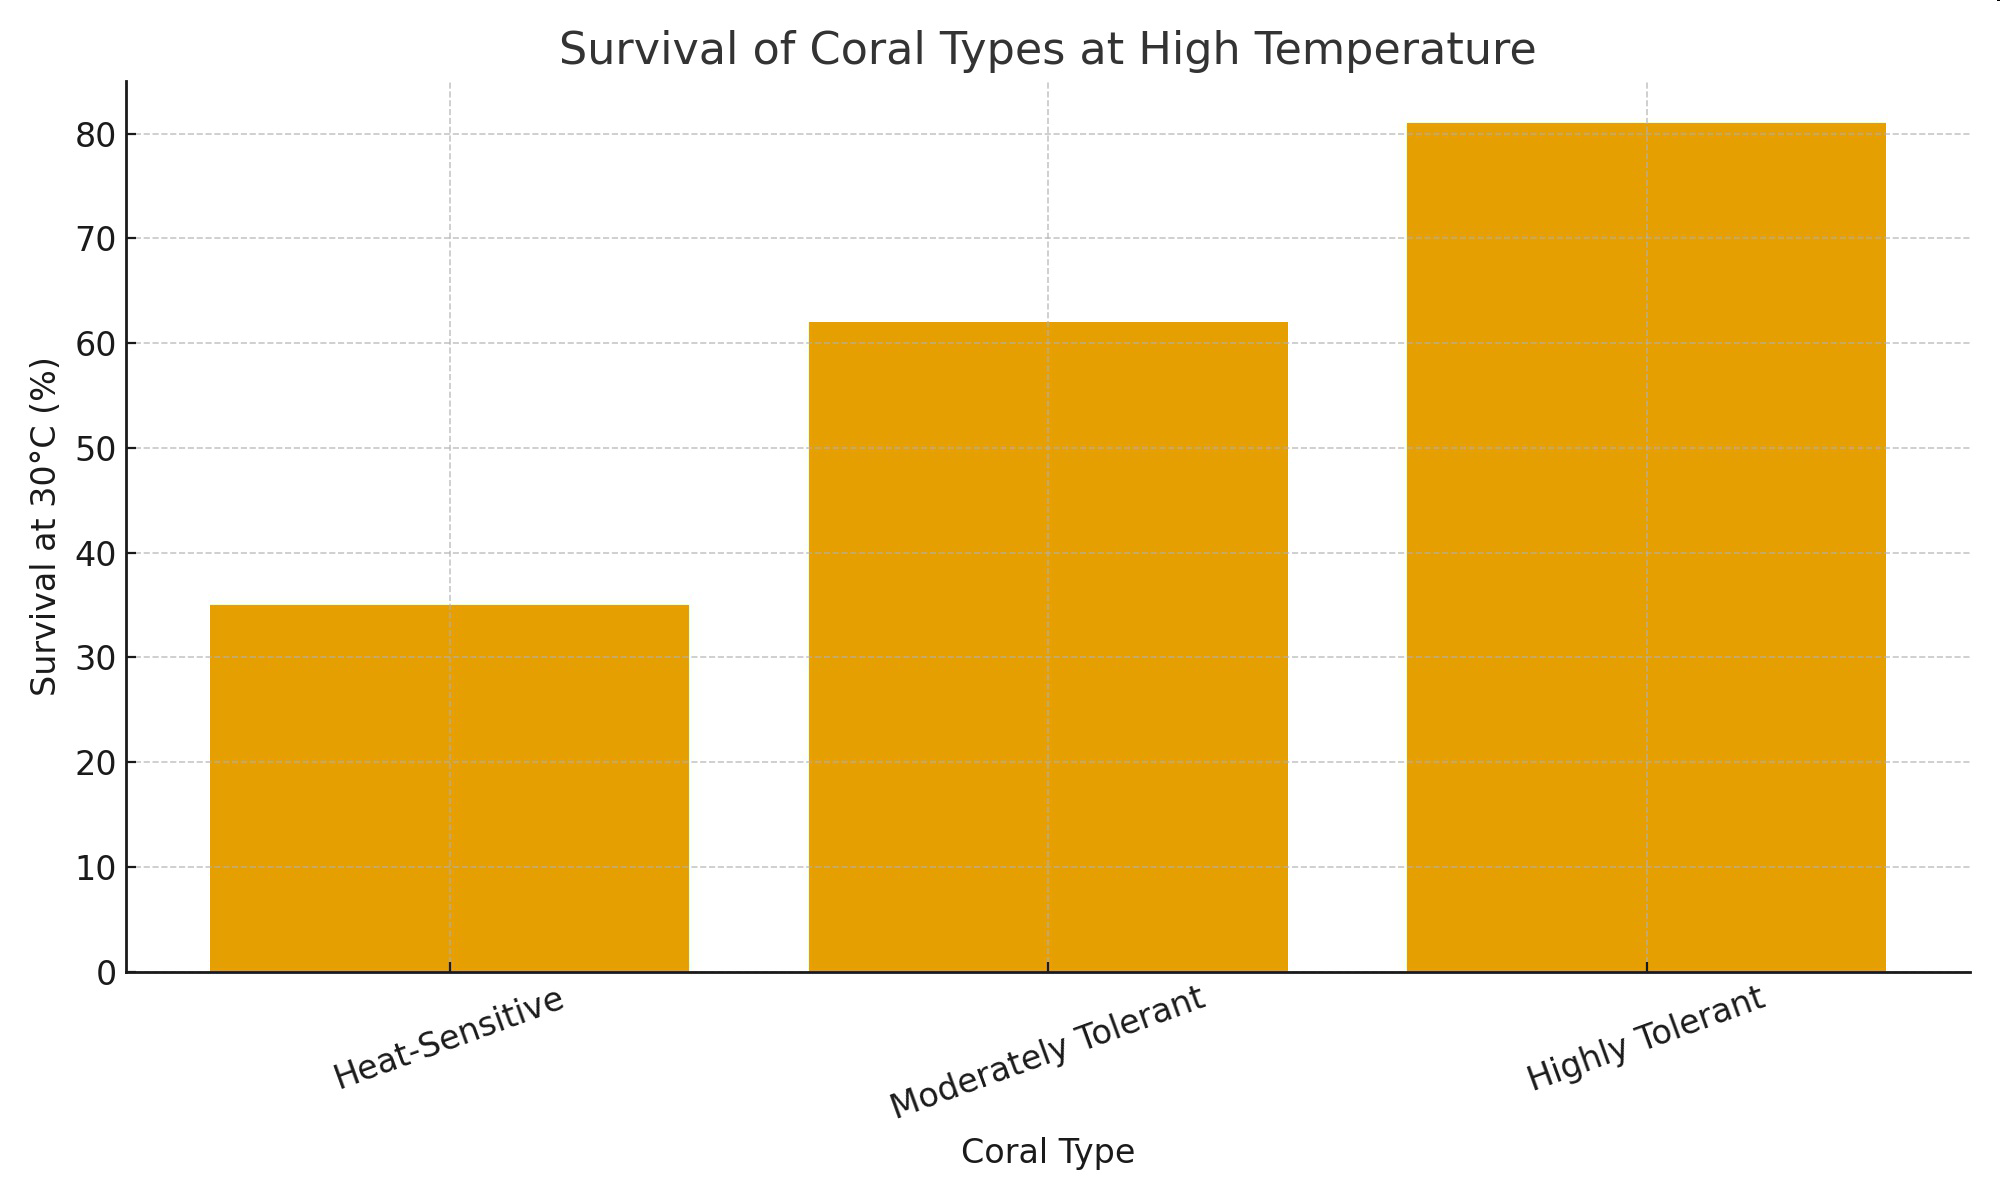
Table 2.
Coral Type | Survival at 30$^\circ$C (%) |
|---|
Heat Sensitive | 35 |
Moderately Tolerant | 62 |
Highly Tolerant | 81 |
Graph of Information - Figure 2.